
- Title
-
Zebrafish cobll1a regulates lipid homeostasis via the RA signaling pathway
- Authors
- Zeng, T., Lv, J., Liang, J., Xie, B., Liu, L., Tan, Y., Zhu, J., Jiang, J., Xie, H.
- Source
- Full text @ Front Cell Dev Biol
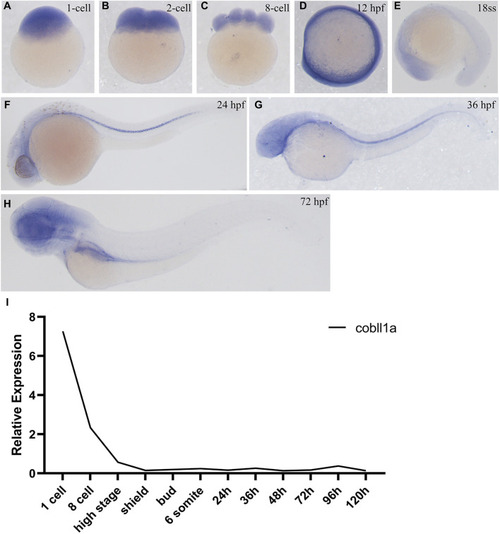
Expression pattern of |
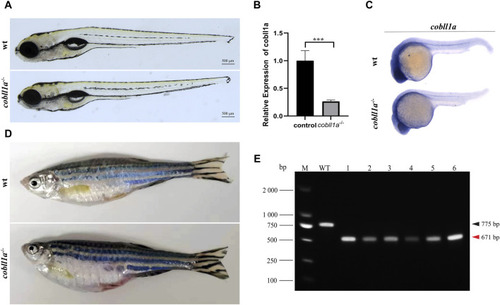
Loss of |
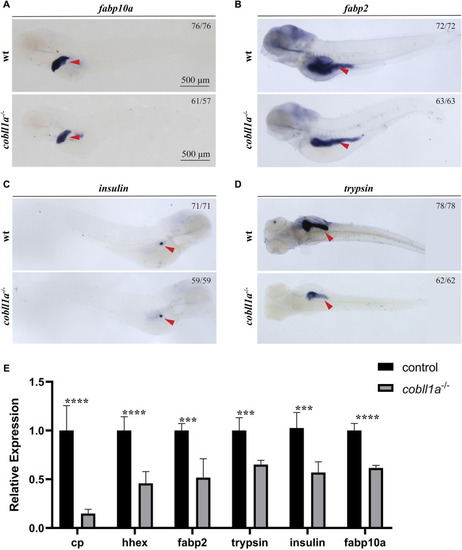
Depicts the abnormal liver development observed in the absence of |
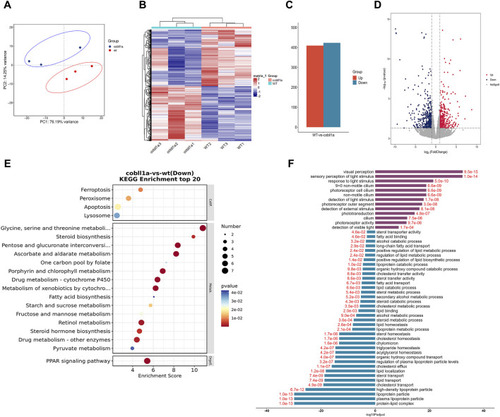
The DEGs analysis of WT and |
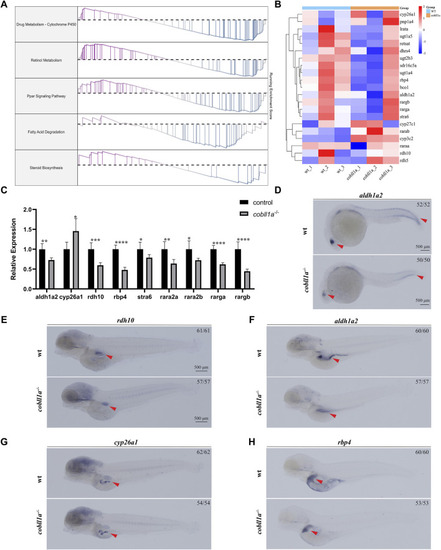
Loss of |
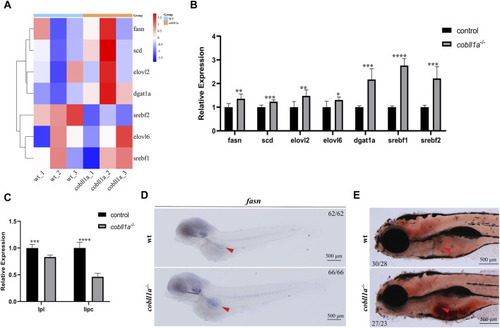
Loss of |
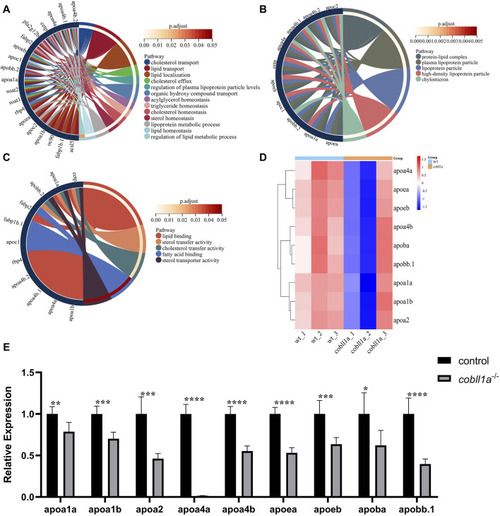
Zebrafish embryos exhibit abnormal lipoprotein metabolism in |