
- Title
-
Ciliary length regulation by intraflagellar transport in zebrafish
- Authors
- Sun, Y., Chen, Z., Jin, M., Xie, H., Zhao, C.
- Source
- Full text @ Elife
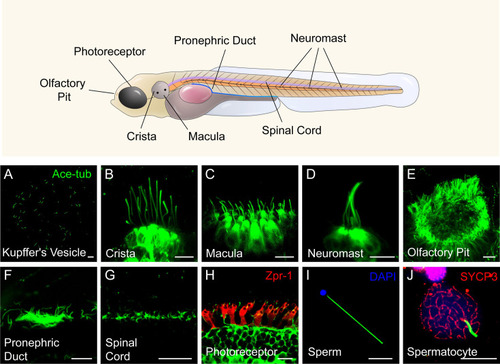
Diverse type of cilia are present in zebrafish. ( |
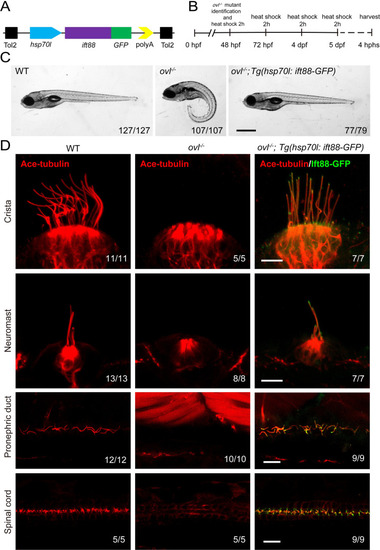
Rescue of ovl mutants with Tg(hsp70l:ift88-GFP) transgene. (A) Schematic diagram of hsp70l:ift88-GFP construct. (B) Procedure of heat shock experiments for ovl mutants rescue assay. hphs, hour post heat shock. (C) External pheontype of 5 dpf wild type, ovl mutant or ovl mutant larvae carrying Tg(hsp70l:ift88-GFP) transgene. The numbers of larvae investigated were shown on the bottom right. (D) Confocal images showing cilia in different type of organs as indicated. Red channel indicates cilia visualized by anti-acetylated ?-tubulin antibody and fluorescence of Tg(hsp70l:ift88-GFP) is showed in green. Scale bars: 200 ?m in panel C and 10 ?m in panel D. |
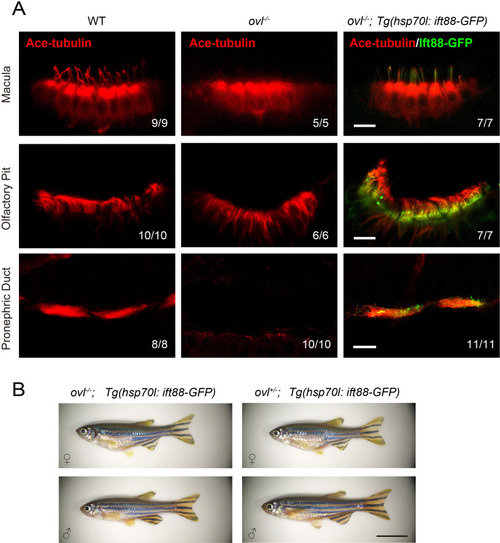
Rescue of ciliogenesis defects in ( |

Intraflagellar transport in different type of cilia. (A?E) Left, Snapshot of Intraflagellar transport videos in different cell types as indicated. Middle (A, B) Snapshot of same cilia at different time points. Arrowheads with the same color indicate the same IFT particle. Right, kymographs illustrating the movement of IFT particles along the axoneme. Horizontal scale bar: 10 ?m and vertical scale bars: 10 s. Representative particle traces are marked with black lines in panels D and E. Yellow arrows denote the cilia used to generating the kymograph. (F) Histograms displaying the velocity of anterograde and retrograde IFT in different type of cilia as indicated. ?Antero.? and ?Retro.? represent anterograde and retrograde transport, respectively. Each plot was fit by a Gaussian distribution. The developmental stages of zebrafish were consistent with (A?E) (G) Summary of IFT velocities in different tissues of zebrafish. Numbers of IFT particles are shown in the brackets. n, number of cilia detected. N, number of zerafish larvae analyzed. hpf, hours post-fertilization. dpf, days post-fertilization. (H) Left, Statistics analysis of cilia length in different tissues of Tg(hsp70l:ift88-GFP) larvae (crista, n=72 cilia from 16 larvae; neuromast, n=31 cilia from 9 larvae; pronephric duct, n=72 cilia from 11 larvae; spinal cord, n=86 cilia from 6 larvae; epidermal cell, n=48 cilia from 18 larvae). Average cilium length: crista, 25.46 ?m; neuromast, 15.2 ?m; pronephric duct, 8.1 ?m; spinal cord, 1.03 ?m; epidermal cell, 0.49 ?m. Right, anterograde and retrograde IFT average velocity in different tissues of zebrafish. (I) Anterograde and retrograde IFT velocities plotted versus cilia length. Linear fit (black line) and coefficient of determination are indicated. (J) Frequency of anterograde and retrograde IFT entering or exiting cilia. (crista, n=47 cilia from 13 larvae; neuromast, n=31 cilia from 13 larvae; pronephric duct, n=43 cilia from 14 larvae; spinal cord, n=27 cilia from 7 larvae; epidermal cell, n=26 cilia from 15 larvae). |
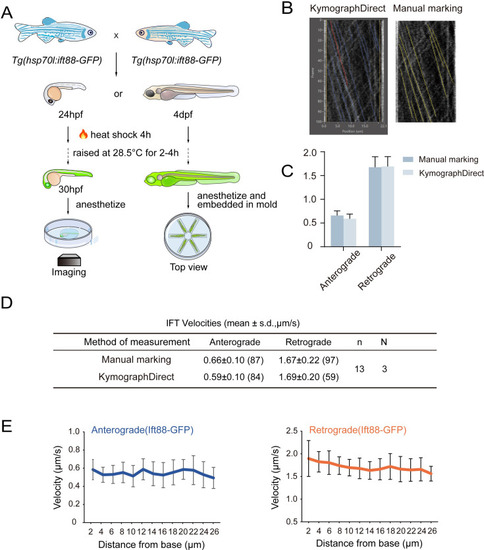
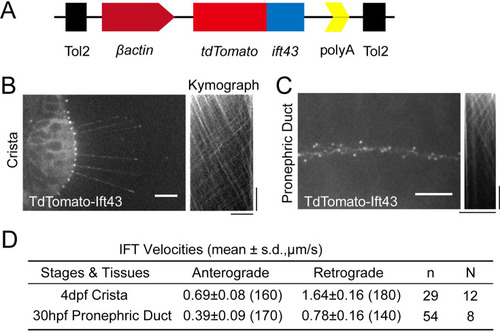
Overview of zebrafish larvae treatments and IFT velocity analysis. ( |
Generation of Tg ( (
|
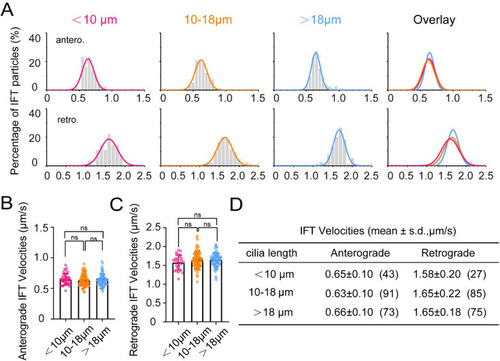
IFT velocity in cilia of different lengths within crista. ( |
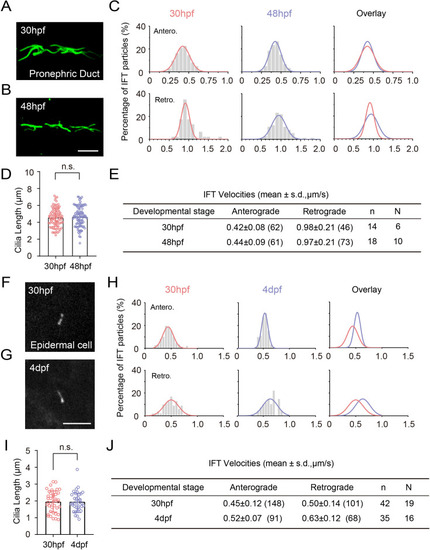
Comparison of cilia length and IFT volecity at different developmental stages. ( |
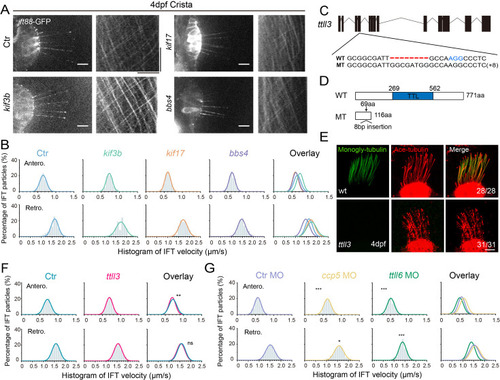
Alterations in motor proteins, BBSome proteins, or tubulin modifications have minimal effects on IFT. (A) Left: Snapshot of IFT videos in crista cilia of 4dpf wild type or mutant larvae as indicated. Right: Kymographs showing IFT particle movement along axoneme visualized with Ift88:GFP. Horizontal scale bar: 10 ?m and vertical scale bar:10 s. (B) Histograms showing anterograde and retrograde IFT velocity in crista cilia of control or mutant larvae. (C) Genomic structure and sequences of wild type and ttll3 mutant allele. PAM sequence of sgRNA target are indicated in blue. (D) Protein domain of Ttll3 in wild type and ttll3 mutants. (E) Confocal images showing crista cilia in 4dpf wild type (wt) or maternal-zygotic (MZ) ttll3 mutant visualized with anti-monoglycylated tubulin antibody (green) and anti-acetylated ?-tubulin antibody (red). (F) Histograms depicting IFT velocity in crista cilia of control and ttll3 mutants. Top, anterograde IFT. Bottom, retrograde IFT.(G) Histograms illustrating IFT velocity in crista cilia of ccp5 or ttll6 morphants. Scale bars: 10 ?m in panel A and 5 ?m in panel E. *p?0.5; *** p?0.001. The average IFT velocity and the number of samples (N) are shown in Supplementary file 1. |
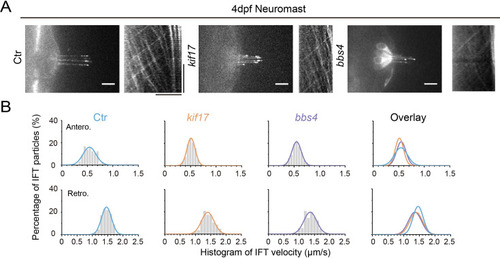
IFT in the cilia of neuromast hair cells of different zebrafish mutants. ( |
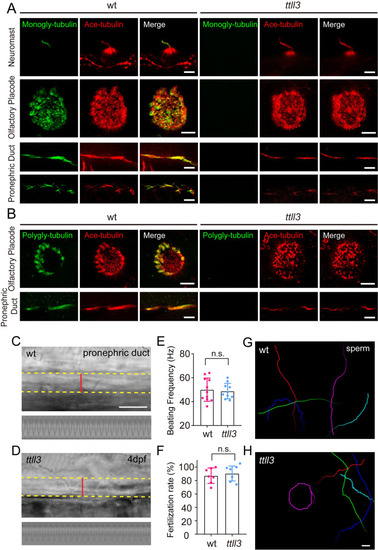
Loss of tubulin glycylation in (
|
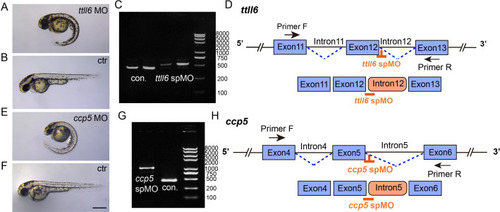
Validation of the efficiency of ttll6 and ccp5 morpholinos. (A, B, E, F) External phenotypes of control, ttll6 and ccp5 morphant embryos at 2 dpf. (C) Agarose gel electrophoresis of RT-PCR amplicons using primer pairs as indicated in panel (D). The PCR product size in the ttll6 morphants was significantly larger than that in the control (con.). (D) Schematic diagram of ttll6 sp MO target sites (orange) and RT-PCR primer positions. Sequencing results indicated that ttll6 morphant exhibited incorrect splicing, with intron12 being incorrectly included in the mature mRNA. (G) Agarose gel analysis of RT-PCR amplicons using primer pairs as indicated in panel (H). The PCR product size in the ccp5 morphant was significantly larger than that in the control (con.). (H) Schematic diagram illustrating the splice donor sites targeted by antisense morpholinos (orange). Injection of ccp5 MO resulted in the production of aberrant transcripts, wherein intron 5 was mis-spliced into the mature mRNA. Scale bar = 500 ?m. From top to bottom, the size of bands in the panel C and panel G is 8000bp, 5000bp, 3000bp, 2000bp, 1000bp, 750bp, 500bp, 250bp and 100bp respectively.Validation of the efficiency of ttll6 and ccp5 morpholinos. (A, B, E, F) External phenotypes of control, ttll6 and ccp5 morphant embryos at 2 dpf. (C) Agarose gel electrophoresis of RT-PCR amplicons using primer pairs as indicated in panel (D). The PCR product size in the ttll6 morphants was significantly larger than that in the control (con.). (D) Schematic diagram of ttll6 sp MO target sites (orange) and RT-PCR primer positions. Sequencing results indicated that ttll6 morphant exhibited incorrect splicing, with intron12 being incorrectly included in the mature mRNA. (G) Agarose gel analysis of RT-PCR amplicons using primer pairs as indicated in panel (H). The PCR product size in the ccp5 morphant was significantly larger than that in the control (con.). (H) Schematic diagram illustrating the splice donor sites targeted by antisense morpholinos (orange). Injection of ccp5 MO resulted in the production of aberrant transcripts, wherein intron 5 was mis-spliced into the mature mRNA. Scale bar = 500 ?m. From top to bottom, the size of bands in the panel C and panel G is 8000bp, 5000bp, 3000bp, 2000bp, 1000bp, 750bp, 500bp, 250bp and 100bp respectively. |
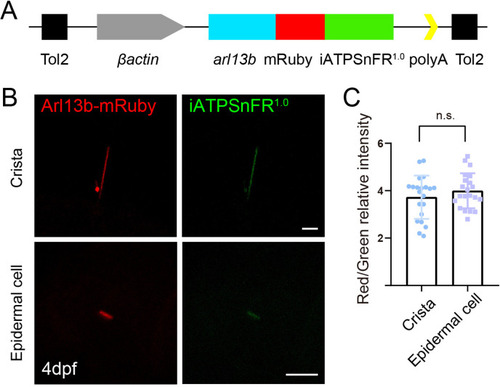
Generation of ATP reporter transgenic line. ( |
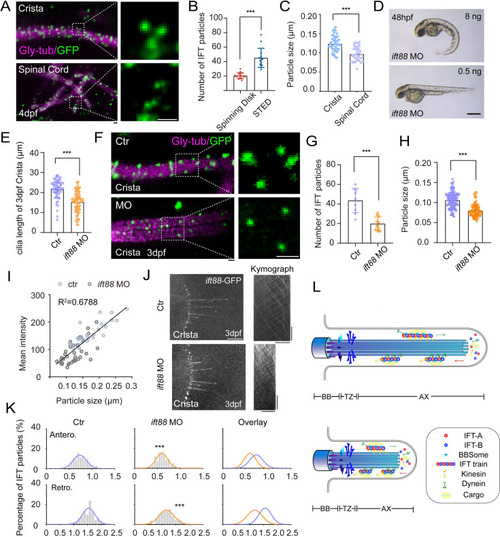
Increased size of IFT fluorescent particles in crista cilia. (A) Representative STED images of crista (top) and spinal cord (bottom) in 4dpf Tg(hsp70l: ift88-GFP) larva. Cilia was stained with anti-monoglycylated tubulin (magenta), and IFT88-GFP particles were counterstained with anti-GFP antibody (green). Enlarged views of the boxed region are displayed on the right. (B) Dot plots showing the number of IFT particles per cilia in crista recorded by spinning disk and STED. (Spinning disk, n=15 cilia from 6 larvae; STED, n=14 cilia from 8 larvae.Two-tailed Mann-Whitney test) (C) Statistical analysis showing IFT particles size in the cilia of ear crista and spinal cord. (Crista, n=44 particles from 7 larvae; Spinal cord, n=35 particles from 5 larvae; Unpaired two-sided Student?s t-test) (D) External phenotypes of 2 dpf zebrafish larvae injected with higher and lower dose of ift88 morpholinos. (E) Cilia length quantification of control and ift88 morphants. (ctr, n=62 cilia from 18 larvae; ift88 MO, n=88 cilia from 17 larvae; Two-tailed Mann-Whitney test) (F) STED images showing IFT particles in crista cilia of 3dpf control or ift88 morphants. Enlarged views of the boxed region are displayed on the right. (G) Dot plots showing the number of IFT particles per cilia in control and ift88 morphants. (ctr, n=9 cilia from 5 larvae; ift88 MO, n=11 cilia from 6 larvae; Unpaired two-sided Student?s t-test) (H) Statistical analysis showing IFT particles size of crista cilia in control or ift88 morphants. (ctr, n=141 particles from 11 larvae; ift88 MO, n=88 particles from 13 larvae; Two-tailed Mann-Whitney test) (I) Mean intensity of IFT particles was plotted together with IFT particle size. Linear fit (black line) and coefficient of determination are indicated. (J) Left, Snapshot of IFT videos in crista cilia of 3dpf control (top) or ift88 morphant (bottom) carrying Tg(hsp70l: ift88-GFP). Right, Kymographs showing movement of IFT particles along axoneme. Horizontal scale bar: 10 ?m and vertical scale bar:10 s. (K) Histograms showing IFT velocity in the crista cilia of 3dpf control or ift88 morphants. (L) Model illustrating IFT with different train sizes in long and short cilia. Scale bars: 0.2 ?m in panel A and F, and 500 ?m in panel I. **p?0.01; *** p?0.001. BB, basal body; TZ, transition zone; AX, axoneme. |