
FIGURE
Figure 4—figure supplement 1—source data 1.
- ID
- ZDB-FIG-241218-41
- Publication
- Sun et al., 2024 - Ciliary length regulation by intraflagellar transport in zebrafish
- Other Figures
-
- Figure 1.
- Figure 2
- Figure 2—figure supplement 1.
- Figure 3
- Figure 3—figure supplement 1—source data 1.
- Figure 3—figure supplement 2—source data 1.
- Figure 3—figure supplement 3—source data 1.
- Figure 3—figure supplement 4—source data 1.
- Figure 4
- Figure 4—figure supplement 1—source data 1.
- Figure 4—figure supplement 2—source data 1.
- Figure 4—figure supplement 3—source data 2.
- Figure 4—figure supplement 4—source data 1.
- Figure 5
- All Figure Page
- Back to All Figure Page
Figure 4—figure supplement 1—source data 1.
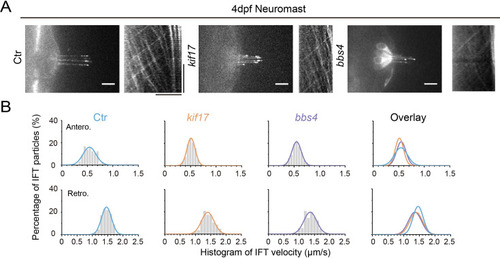
IFT in the cilia of neuromast hair cells of different zebrafish mutants. ( |
Expression Data
Expression Detail
Antibody Labeling
Phenotype Data
Phenotype Detail
Acknowledgments
This image is the copyrighted work of the attributed author or publisher, and
ZFIN has permission only to display this image to its users.
Additional permissions should be obtained from the applicable author or publisher of the image.
Full text @ Elife