Image
Figure Caption

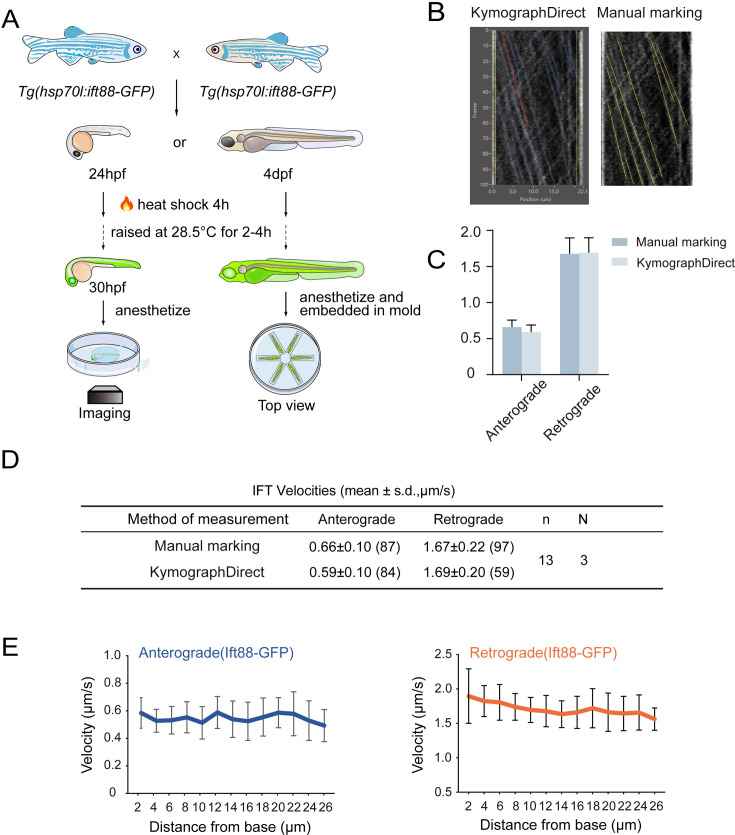
Figure 3—figure supplement 1—source data 1. Overview of zebrafish larvae treatments and IFT velocity analysis.

(A) Diagram showing the procedure of heat shock treatments of transgenic zebrafish larvae (see Materials and methods for details). (B) Representative kymographs illustrating the movement of IFT particles along the axoneme using automated and manual marking methods. Left, lines represent trajectories fitted by KymographDirect. Right, particle traces are manually marked with lines. (C) Quantification of anterograde and retrograde average velocities in 4dpf crista cilia using two speed calculation methods. (D) Summary of anterograde and retrograde average velocities in 4dpf crista cilia using two speed calculation methods. Numbers of IFT particles are shown in the brackets. n, number of cilia. N, number of zerafish larvae. (E) Quantification of anterograde and retrograde velocities along the entire length of crista cilia. n=11 cilia from 15 larvae.

Acknowledgments
This image is the copyrighted work of the attributed author or publisher, and ZFIN has permission only to display this image to its users. Additional permissions should be obtained from the applicable author or publisher of the image. Full text @ Elife