
Figure 4—figure supplement 3—source data 2.
- ID
- ZDB-IMAGE-241218-32
- Source
- Figures for Sun et al., 2024
|
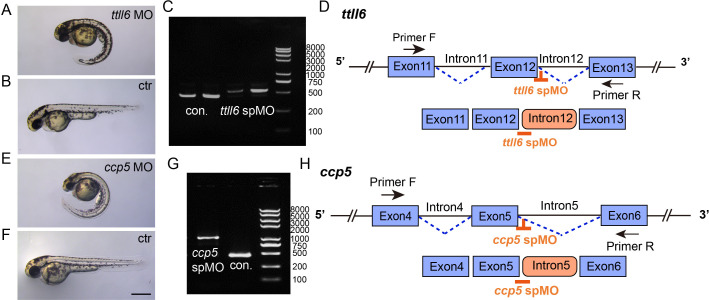
Figure 4—figure supplement 3—source data 2. Validation of the efficiency of ttll6 and ccp5 morpholinos. (A, B, E, F) External phenotypes of control, ttll6 and ccp5 morphant embryos at 2 dpf. (C) Agarose gel electrophoresis of RT-PCR amplicons using primer pairs as indicated in panel (D). The PCR product size in the ttll6 morphants was significantly larger than that in the control (con.). (D) Schematic diagram of ttll6 sp MO target sites (orange) and RT-PCR primer positions. Sequencing results indicated that ttll6 morphant exhibited incorrect splicing, with intron12 being incorrectly included in the mature mRNA. (G) Agarose gel analysis of RT-PCR amplicons using primer pairs as indicated in panel (H). The PCR product size in the ccp5 morphant was significantly larger than that in the control (con.). (H) Schematic diagram illustrating the splice donor sites targeted by antisense morpholinos (orange). Injection of ccp5 MO resulted in the production of aberrant transcripts, wherein intron 5 was mis-spliced into the mature mRNA. Scale bar = 500 ?m. From top to bottom, the size of bands in the panel C and panel G is 8000bp, 5000bp, 3000bp, 2000bp, 1000bp, 750bp, 500bp, 250bp and 100bp respectively.Validation of the efficiency of ttll6 and ccp5 morpholinos. (A, B, E, F) External phenotypes of control, ttll6 and ccp5 morphant embryos at 2 dpf. (C) Agarose gel electrophoresis of RT-PCR amplicons using primer pairs as indicated in panel (D). The PCR product size in the ttll6 morphants was significantly larger than that in the control (con.). (D) Schematic diagram of ttll6 sp MO target sites (orange) and RT-PCR primer positions. Sequencing results indicated that ttll6 morphant exhibited incorrect splicing, with intron12 being incorrectly included in the mature mRNA. (G) Agarose gel analysis of RT-PCR amplicons using primer pairs as indicated in panel (H). The PCR product size in the ccp5 morphant was significantly larger than that in the control (con.). (H) Schematic diagram illustrating the splice donor sites targeted by antisense morpholinos (orange). Injection of ccp5 MO resulted in the production of aberrant transcripts, wherein intron 5 was mis-spliced into the mature mRNA. Scale bar = 500 ?m. From top to bottom, the size of bands in the panel C and panel G is 8000bp, 5000bp, 3000bp, 2000bp, 1000bp, 750bp, 500bp, 250bp and 100bp respectively.