Image
Figure Caption

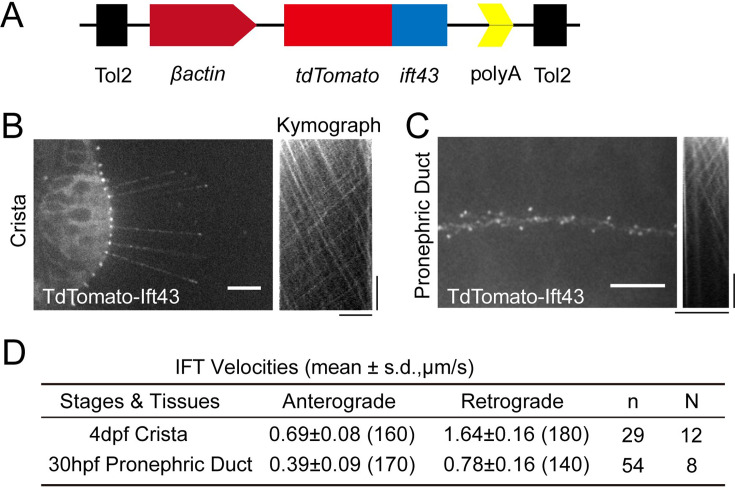
Figure 3—figure supplement 2—source data 1. Generation of Tg (βactin:tdTomato-ift43) transgene for IFT imaging.

(A) Schematic diagram showing βactin:tdTomato-ift43 transgenic construct. (B–C) Left, Snapshot of Intraflagellar transport videos in cilia of ear crista and pronephric duct epithelial cells. Right, kymographs illustrating the movement of IFT particles along the axoneme. Horizontal scale bar = 10 μm. Vertical scale bar = 10 s. (D) Summary of the anterograde and retrograde velocities of IFT measured in embryos expressing Tg(βactin:tdTomato-ift43). Numbers of IFT particles are shown in the brackets. n, number of cilia. N, number of zerafish larvae.

Acknowledgments
This image is the copyrighted work of the attributed author or publisher, and ZFIN has permission only to display this image to its users. Additional permissions should be obtained from the applicable author or publisher of the image. Full text @ Elife