
|
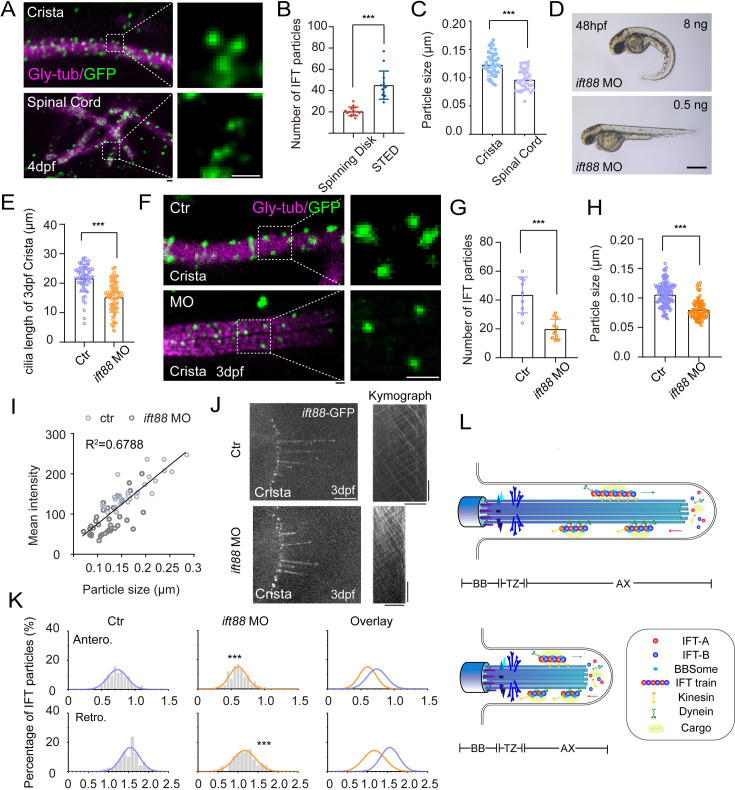
Figure 5 Increased size of IFT fluorescent particles in crista cilia. (A) Representative STED images of crista (top) and spinal cord (bottom) in 4dpf Tg(hsp70l: ift88-GFP) larva. Cilia was stained with anti-monoglycylated tubulin (magenta), and IFT88-GFP particles were counterstained with anti-GFP antibody (green). Enlarged views of the boxed region are displayed on the right. (B) Dot plots showing the number of IFT particles per cilia in crista recorded by spinning disk and STED. (Spinning disk, n=15 cilia from 6 larvae; STED, n=14 cilia from 8 larvae.Two-tailed Mann-Whitney test) (C) Statistical analysis showing IFT particles size in the cilia of ear crista and spinal cord. (Crista, n=44 particles from 7 larvae; Spinal cord, n=35 particles from 5 larvae; Unpaired two-sided Student?s t-test) (D) External phenotypes of 2 dpf zebrafish larvae injected with higher and lower dose of ift88 morpholinos. (E) Cilia length quantification of control and ift88 morphants. (ctr, n=62 cilia from 18 larvae; ift88 MO, n=88 cilia from 17 larvae; Two-tailed Mann-Whitney test) (F) STED images showing IFT particles in crista cilia of 3dpf control or ift88 morphants. Enlarged views of the boxed region are displayed on the right. (G) Dot plots showing the number of IFT particles per cilia in control and ift88 morphants. (ctr, n=9 cilia from 5 larvae; ift88 MO, n=11 cilia from 6 larvae; Unpaired two-sided Student?s t-test) (H) Statistical analysis showing IFT particles size of crista cilia in control or ift88 morphants. (ctr, n=141 particles from 11 larvae; ift88 MO, n=88 particles from 13 larvae; Two-tailed Mann-Whitney test) (I) Mean intensity of IFT particles was plotted together with IFT particle size. Linear fit (black line) and coefficient of determination are indicated. (J) Left, Snapshot of IFT videos in crista cilia of 3dpf control (top) or ift88 morphant (bottom) carrying Tg(hsp70l: ift88-GFP). Right, Kymographs showing movement of IFT particles along axoneme. Horizontal scale bar: 10 ?m and vertical scale bar:10 s. (K) Histograms showing IFT velocity in the crista cilia of 3dpf control or ift88 morphants. (L) Model illustrating IFT with different train sizes in long and short cilia. Scale bars: 0.2 ?m in panel A and F, and 500 ?m in panel I. **p?0.01; *** p?0.001. BB, basal body; TZ, transition zone; AX, axoneme.