Image
Figure Caption

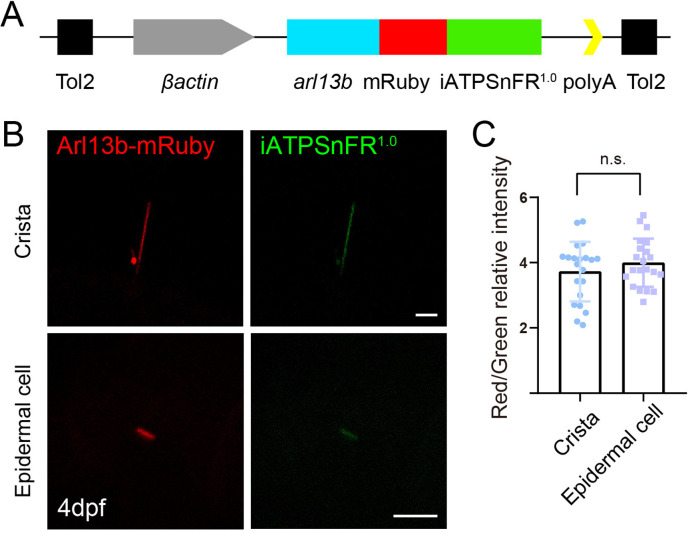
Figure 4—figure supplement 4—source data 1. Generation of ATP reporter transgenic line.

(A) Schematic diagram of βactin: arl13b-mRuby-iATPSnFR1.0 transgenic construct. (B) Confocal images showing cilia of crista and epidermal cell in 4dpf transgenic embryos. (C) Statistical results of relative fluorescence intensity (ratio of red fluorescence intensity vs green fluorescence intensity) in cilia of crista and epidermal cells (crista, n=22 cilia from 17 larvae; epidermal cell, n=21 cilia from 13 larvae. Mann-Whitney test. n.s., not significant, p>0.05). Scale bar = 5 μm. Time-lapse images were continuously collected at an exposure time of 200ms. The display rate was 20 frames per second. Scale bar: 10 μm. The elapsed time is displayed in the top left corner.

Acknowledgments
This image is the copyrighted work of the attributed author or publisher, and ZFIN has permission only to display this image to its users. Additional permissions should be obtained from the applicable author or publisher of the image. Full text @ Elife