
Figure 4
- ID
- ZDB-FIG-241218-40
- Publication
- Sun et al., 2024 - Ciliary length regulation by intraflagellar transport in zebrafish
- Other Figures
-
- Figure 1.
- Figure 2
- Figure 2—figure supplement 1.
- Figure 3
- Figure 3—figure supplement 1—source data 1.
- Figure 3—figure supplement 2—source data 1.
- Figure 3—figure supplement 3—source data 1.
- Figure 3—figure supplement 4—source data 1.
- Figure 4
- Figure 4—figure supplement 1—source data 1.
- Figure 4—figure supplement 2—source data 1.
- Figure 4—figure supplement 3—source data 2.
- Figure 4—figure supplement 4—source data 1.
- Figure 5
- All Figure Page
- Back to All Figure Page
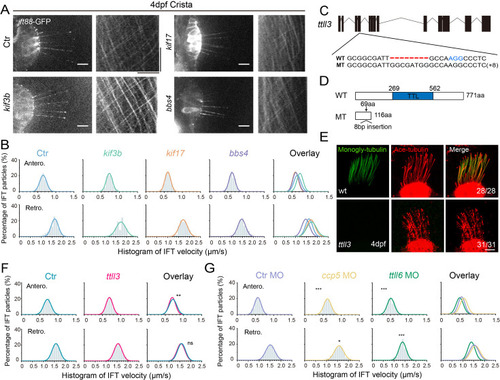
Alterations in motor proteins, BBSome proteins, or tubulin modifications have minimal effects on IFT. (A) Left: Snapshot of IFT videos in crista cilia of 4dpf wild type or mutant larvae as indicated. Right: Kymographs showing IFT particle movement along axoneme visualized with Ift88:GFP. Horizontal scale bar: 10 ?m and vertical scale bar:10 s. (B) Histograms showing anterograde and retrograde IFT velocity in crista cilia of control or mutant larvae. (C) Genomic structure and sequences of wild type and ttll3 mutant allele. PAM sequence of sgRNA target are indicated in blue. (D) Protein domain of Ttll3 in wild type and ttll3 mutants. (E) Confocal images showing crista cilia in 4dpf wild type (wt) or maternal-zygotic (MZ) ttll3 mutant visualized with anti-monoglycylated tubulin antibody (green) and anti-acetylated ?-tubulin antibody (red). (F) Histograms depicting IFT velocity in crista cilia of control and ttll3 mutants. Top, anterograde IFT. Bottom, retrograde IFT.(G) Histograms illustrating IFT velocity in crista cilia of ccp5 or ttll6 morphants. Scale bars: 10 ?m in panel A and 5 ?m in panel E. *p?0.5; *** p?0.001. The average IFT velocity and the number of samples (N) are shown in Supplementary file 1. |