Figure 3—figure supplement 4—source data 1.

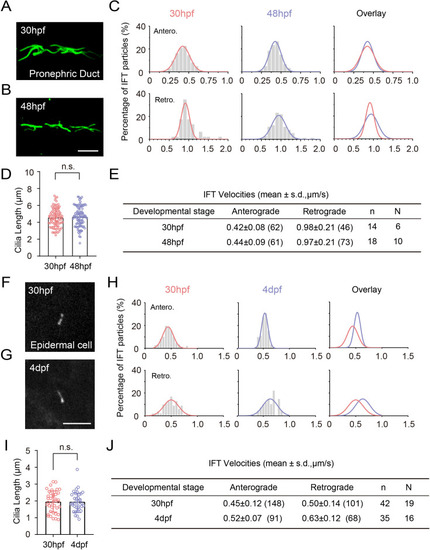
Comparison of cilia length and IFT volecity at different developmental stages.

(A, B) Representative images showing cilia in the pronephric duct labeled with anti-acetylated tubulin in 30 hpf and 48 hpf zebrafish larvae. (C) Histograms displaying the velocity of anterograde and retrograde IFT in pronephric duct single cilia of 30 hpf and 48 hpf zebrafish larvae. (D) Length of pronephric duct single cilia of 30 hpf and 48 hpf zebrafish larvae (30 hpf, n=94; 48 hpf, n=97, Unpaired two-sided Student’s t-test). (E) Summary of anterograde and retrograde average velocities in pronephric duct single cilia. (F, G) Snapshot of Tg(hsp70l: ift88-GFP) larvae IFT videos in epidermal cells of 30 hpf and 4 dpf zebrafish larvae. (H) Histograms displaying the velocity of anterograde and retrograde IFT in epidermal cells cilia. (I) Length of epidermal cells cilia (30 hpf, n=40; 4 dpf, n=36, Unpaired two-sided Student’s t-test) (J) Summary of anterograde and retrograde average velocities in epidermal cells cilia. ‘Antero.’ and ‘Retro.’ represent anterograde and retrograde transport, respectively. Each plot was fit by a Gaussian distribution. Scale bars = 5 μm. Numbers of IFT particles are shown in the brackets. n, number of cilia. N, number of zerafish larvae. n.s., not significant, p>0.05.

Expression Data

Expression Detail
Antibody Labeling
Phenotype Data

Phenotype Detail
Acknowledgments
This image is the copyrighted work of the attributed author or publisher, and ZFIN has permission only to display this image to its users. Additional permissions should be obtained from the applicable author or publisher of the image. Full text @ Elife