- Title
-
sept7b is required for the differentiation of pancreatic endocrine progenitors
- Authors
- Dash, S.N., Hakonen, E., Ustinov, J., Otonkoski, T., Andersson, O., Lehtonen, S.
- Source
- Full text @ Sci. Rep.
|
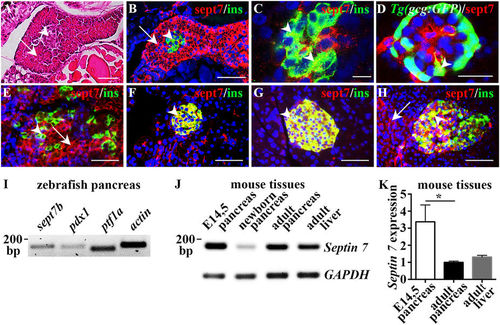
Expression of septin 7 in vertebrate pancreas. (A) Longitudinal section of 4?dpf zebrafish larva stained with hematoxylin and eosin shows endocrine (arrowhead) and exocrine cells (arrow). (B) Longitudinal section of 4?dpf zebrafish larva immunostained for septin 7 (red) and insulin (green) shows cytoplasmic localization of septin 7 in exocrine cells (arrow) and ?-cells positive for insulin (arrowhead). (C) Confocal image of a 4?dpf zebrafish larvae immunostained as whole-mount for septin 7 (red) and insulin (green) confirms that septin 7 is expressed in ?-cells (arrowheads). (D) Confocal image of 4?dpf Tg(gcg:GFP) zebrafish larva stained as whole mount shows localization of septin 7 (red) in glucagon-positive ?-cells (arrowhead). (E) Septin 7 (red) shows cytoplasmic localization in E14.5 mouse pancreas in ?-cells (arrowhead) stained for insulin (green) and in exocrine cells (arrow). (F,G) Septin 7 (red) concentrates in the islets (arrowheads) of newborn (F) and adult (G) mouse pancreas. Staining for insulin (green) visualizes ?-cells. (H) In adult human pancreas septin 7 (red) localizes in the islets (arrowhead). Staining for insulin (green) visualizes ?-cells. A few exocrine cells are also positive for septin 7 (arrow). In (B?H), nuclei are labeled with DAPI (blue). (I) RT-PCR confirms the expression of sept7b in adult zebrafish pancreas along with pdx1, ptf1a, and actin. (J) RT-PCR confirms the expression of Septin 7 in embryonic day 14.5 (E14.5), newborn and adult pancreas and adult liver in mouse. GAPDH is used as a control. (K) Quantitative RT-PCR shows that the expression of Septin 7 is 3-fold higher in embryonic pancreas than in the adult pancreas and liver. The difference in the expression level of Septin 7 in the adult liver and adult pancreas is not significant. The expression of Septin 7 was normalized to Cyclophilin G. Error bars represent mean?±?SEM (n?=?4?5). *p???0.05. Scale bar: (A) (25??M), (B) (30??M), (C) (7.5??m), (D) (10??m), (E?H) (30??m). |
|
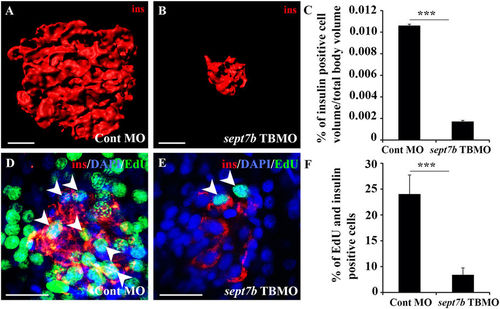
Knockdown of sept7b reduces ?-cell volume and inhibits ?-cell proliferation. (A,B) Three-dimensional rendered z-stack confocal images generated from control MO-injected (A) and sept7b TBMO-injected (B) zebrafish larva at 5?dpf stained as whole mounts with antibodies against insulin. (C) Insulin-positive cell volume is significantly reduced in sept7b TBMO-injected zebrafish larvae at 5?dpf. (D,E) Three-dimensional rendered z-stack confocal images generated from control MO-injected (D) and sept7b TBMO-injected (E) zebrafish larva at 5?dpf treated with EdU (green) to visualize proliferating cells and stained with antibodies against insulin (red) to visualize ?-cells. DAPI shows the nuclei (blue). Arrowheads indicate proliferating ?-cells (positive for both EdU and insulin). (F) ?-cell proliferation is significantly reduced in sept7b knockdown larvae. Error bars represent mean?±?SEM. Scale bar (A,B) (10??m); (D,E) (10??m). ***p???0.0005. |
|
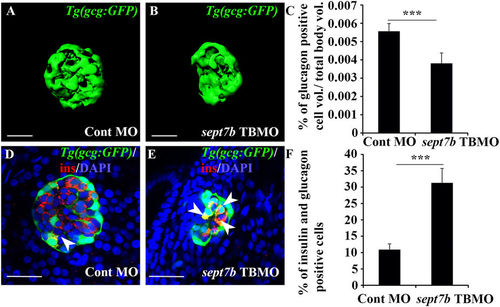
Knockdown of sept7b reduces ?-cell volume and increases bihormonal cells positive for both insulin and glucagon. (A,B) Isosurface rendered z-stack confocal images generated from control MO-injected (A) and sept7b TBMO-injected (B) Tg(gcg:GFP) zebrafish larva at 4?dpf. Glucagon-positive ?-cells are green. (C) Glucagon-positive cell volume is significantly reduced in sept7b TBMO-injected zebrafish larvae at 4?dpf. (D,E) Cells positive for both insulin (red) and glucagon (green) (bihormonal cells; arrowheads) are increased in sept7b TBMO-injected Tg(gcg:GFP) zebrafish larvae 4?dpf (E) compared to control MO-injected larva (D). In (D,E), nuclei are labeled with DAPI (blue). (F) Quantification of the percentage of bihormonal cells relative to insulin positive cells. Scale bar: (A,B) (25??m); (D,E) (20??m). Error bars represent mean?±?SEM. ***p???0.0005. |
|
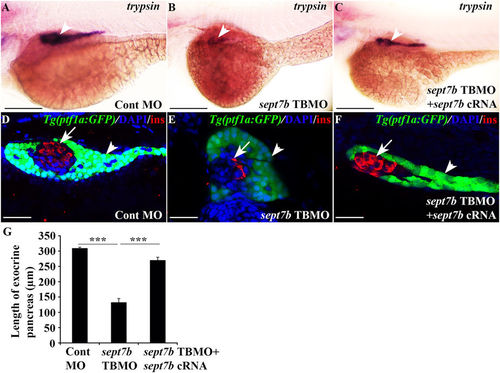
Depletion of sept7b leads to downregulation of exocrine marker trypsin and abnormal exocrine morphology. (A,B) Expression of trypsin in exocrine pancreas (arrowhead) is reduced in 3?dpf sept7b knockdown larvae (B) compared to control MO-injected larvae (A). (C) Co-injection of sept7b cRNA with sept7b TBMO restores trypsin expression (arrowhead). (D,E) sept7b TBMO-injected Tg(ptf1a:GFP) zebrafish larvae (E) show abnormal exocrine morphology and reduced size of the pancreatic tail (arrowhead) compared to the control MO-injected larvae (D) at 3?dpf. ?-cells are labeled with insulin (red; arrow). (F) Co-injection of sept7b cRNA with sept7b TBMO partially restores the morphology of exocrine pancreas. In (D?F), nuclei are labeled with DAPI (blue). (G) The length of the exocrine pancreas, measured from 3?dpf zebrafish embryos using trypsin as a marker, is significantly decreased by sept7b knockdown compared to the control. Co-injection of sept7b cRNA with sept7b TBMO restores the length of the exocrine pancreas. Scale bar: (A?C) (75??m); (D?F) (25??m). Error bars represent mean?±?SEM. ***p???0.0005. EXPRESSION / LABELING:
PHENOTYPE:
|
|
Pancreatic progenitors are increased in sept7b knockdown larvae. (A?D) Pdx1-positive cells (red; arrow) in control MO-injected (A,C) and sept7b TBMO-injected (B,D) Tg(ptf1a:GFP) zebrafish larvae at 3?dpf. In (A,B) the exocrine pancreas (arrowhead) is visualized by ptf1a (green) and the nuclei are labelled with DAPI (blue). (C) and (D) are corresponding images visualizing Pdx1 only. (E) Pdx1-positive cells are significantly increased in sept7b knockdown larvae compared to control MO-injected larvae. (F) Schematic representation showing that control MO-injected larva show differentiation of Pdx1-positive pre-pancreatic progenitors, which give rise to mature insulin- and glucagon-positive ?- and ?-cells, respectively. The islet cells in sept7b TBMO-injected larva fail to differentiate and present bihormonal cells positive for both insulin and glucagon (see also Fig. 3). Scale bar: (A?D) (25??m). Error bars represent mean?±?SEM. *p???0.05. EXPRESSION / LABELING:
PHENOTYPE:
|
|
Shh expression is missing from endoderm of sept7b knockdown embryos. (A) Lateral view of 24?hpf zebrafish embryo injected with the control MO showing expression of sonic hedgehog (shh) in the endoderm (arrowhead) and notochord (arrow). (B) Endodermal expression of shh (arrowhead) is missing from sept7b knockdown embryos whereas expression in notochord is present (arrow). (C) Co-injection of sept7b cRNA with sept7b TBMO partially rescues the expression of shh in the endoderm (arrowhead). (D) Notch receptor expression is downregulated in sept7b knockdown larvae. The expression of notch1a and notch1b mRNAs is significantly downregulated in sept7b knockdown larvae compared to control MO-injected larvae. Co-injection of sept7b cRNA with sept7b TBMO partially rescues downregulation of notch1a and notch1b. The expression of notch1a and notch1b were normalized to actin. (E) The expression of ascl1b mRNA is increased at 12?hpf and 5?dpf in sept7b TBMO-injected larvae compared to control MO-injected larvae. Scale bar: (A?C) (50??m). Error bars represent mean?±?SEM. *p???0.05; **p???0.005; ***p???0.0005. EXPRESSION / LABELING:
PHENOTYPE:
|
|
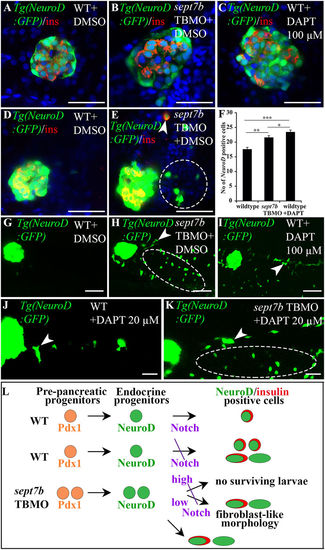
Endocrine progenitors are increased in islets, exocrine pancreas and gut epithelium in sept7b-depleted larvae. (A?C) 5?dpf Tg(NeuroD:GFP) zebrafish larva treated with DMSO (A), sept7b TBMO (B), or 100??M Notch-inhibitor DAPT (C) stained for insulin (red). (D,E) Enhanced exposure of 5?dpf Tg(NeuroD:GFP) larvae treated with DMSO (D) or sept7b TBMO (E) reveal excessive induction of NeuroD-positive cells in the extrapancreatic duct of sept7b-depleted larvae (circle). Occasional insulin and NeuroD double-positive cells (arrowhead) are observed in the intrapancreatic duct (IPD) of sept7b-depleted larva but not in controls. (F) NeuroD-positive endocrine cells are increased in sept7b TBMO- and 100??M DAPT-treated larvae compared to DMSO-treated controls. (G?I) Enhanced exposures of 5?dpf Tg(NeuroD:GFP) larva treated with DMSO (G), sept7b TBMO (H), or 100??M DAPT (I) reveal NeuroD-positive cells in exocrine pancreas (arrowhead) and gut epithelium (ellipse) in sept7b TBMO- and DAPT-treated larvae (H,I) but not in controls (G). (J,K) 20??M DAPT causes NeuroD-positive endocrine cell formation (arrowhead) in the IPD and gut epithelium (ellipse) in sept7b-depleted larvae (K). Only few NeuroD-positive cells (arrowhead) are observed in the IPD of 20??M DAPT-treated controls (J). (L) Schematic representation of pancreatic progenitor differentiation in wild type (WT), sept7b TBMO-treated and Notch-inhibited zebrafish larvae. In WT larva early Pdx1-positive pre-pancreatic progenitors give rise to late NeuroD-positive endocrine progenitors. Notch-responsive endocrine progenitors differentiate into NeuroD- and insulin-positive ?-cells. Inhibition of Notch by 100??M DAPT in WT larvae leads to differentiation of numerous NeuroD and insulin-positive progenitors in the islets. Notch inhibition also leads to emergence of NeuroD-positive cells in the pancreatic tail region, with fibroblast-like morphology. sept7b depletion leads to similar phenotype as inhibition of Notch: NeuroD-positive progenitors increase in the endocrine and exocrine pancreas, with fibroblast-type morphology. Treatment of sept7b-depleted larvae with 100??M DAPT (high) leads to lethal toxicity, whereas 20??M DAPT (low) is less toxic and the surviving larvae show induction of endocrine cells in the IPD and gut epithelium. Error bars represent mean?±?SEM. *p???0.05; **p???0.01; ***p???0.005. Scale bar: (A?E) (25??m); (G?I) (50??m); (J?K) (30??m). |
|
Knockdown of sept7b affects glucose homeostasis. A) The amount of whole body glucose is significantly increased in sept7b knockdown larva compared to control MO-injected larvae at 5?dpf. DMSO in buffer served as a negative control. (B) qRT-PCR indicates that 40?mM exogenous glucose treatment for 24?h increases insa expression in wild type and control MO-injected zebrafish larvae at 5?dpf. insa expression is downregulated in sept7b knockdown larvae compared to the controls. Treatment of sept7b knockdown larvae with exogenous glucose increases insa expression, but the level remains clearly lower compared to wild type and control MO-treated larvae with or without exogenous glucose treatment. (C) qRT-PCR indicates that 40?mM exogenous glucose treatment for 24?h downregulates pck1 expression in wild type and control MO-injected zebrafish larvae at 5?dpf. pck1 expression is upregulated in sept7b knockdown larvae compared to the controls. Treatment of sept7b knockdown larvae with exogenous glucose decreases pck1 expression, but the level remains clearly higher compared to wild type and control MO-treated larvae with or without exogenous glucose treatment. This indicates defective regulation of glucose homeostasis in sept7b knockdown larvae. In (B,C), insa and pck1 were normalized to ?-actin. Error bars represent mean?±?SEM. *p???0.05; **p???0.005; ***p???0.0005. |
|
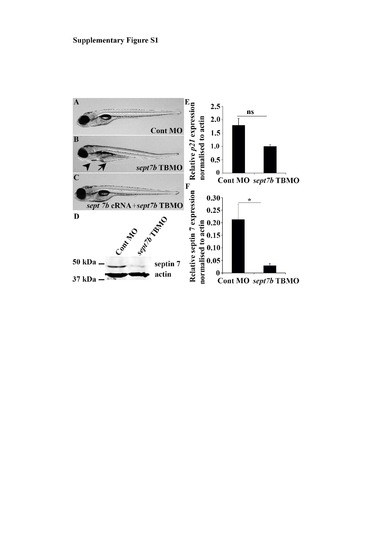
sept7b TBMO specifically knocks down sept7b in zebrafish larvae. (A-C) Images of zebrafish larvae injected with control MO (A), sept7b TBMO (B) and sept7b TBMO together with sept7b cRNA (C) at 5 dpf. Knockdown of sept7b leads to pericardial (arrowhead) and yolk sac (arrow) edema, and co-injection of sept7b cRNA with sept7b TBMO rescues the phenotype. (D) The expression of septin 7 protein is reduced in sept7b TBMO-injected zebrafish larvae compared to control MO-injected larvae at 5 dpf. Larvae were lysed in RIPA buffer as previously described1 and proteins were separated by SDS-PAGE. Western blotting was performed with a rabbit polyclonal antibody against septin 7 (Santa Cruz Biotechnology, Santa Cruz, CA) and a mouse monoclonal antibody against actin (Sigma-Aldrich, St Louis, MO) followed by Alexa-Fluor-680-conjugated donkey anti-rabbit (Invitrogen, Carlsbad, CA) and IR-Dye-800-conjugated donkey anti-mouse IgGs (LI-COR, Lincoln, NE). (E) qPCR reveals that the expression of p21 mRNA shows a trend of downregulation in sept7b TBMO-injected larvae compared to control MO-injected larvae at 5 dpf. (F) Quantification of four replicate blots similar to the blot in (A) reveals significant downregulation of septin 7 protein in sept7b TBMO-injected larvae compared to control MO-injected larvae. Error bars represent mean ± SEM. ns, non-significant; * p? 0.05. |
|
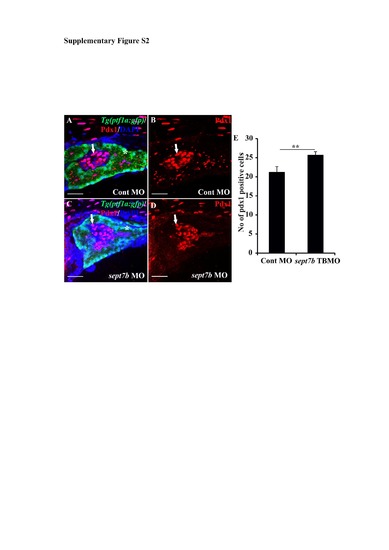
Pdx1-positive pancreatic cells are increased in sept7b knockdown larvae at 5 dpf. (A-D) Pdx1-positive cells (red; arrows) in control MOinjected (A-B) and sept7b TBMO-injected (C-D) Tg(ptf1a:GFP) zebrafish larvae at 3 dpf. In (A) and (C) the exocrine pancreas is visualized by ptf1a (green) and the nuclei are labeled with DAPI (blue). (B) and (D) are corresponding images visualizing Pdx1 only. Asterisk (*) marks the exocrine pancreas. (E) Pdx1-positive cells are significantly increased in sept7b knockdown larvae compared to control MO-injected larvae. Error bars represent mean ± SEM. ** p? 0.005. Scale bar: A-D (25 ?m). |
|
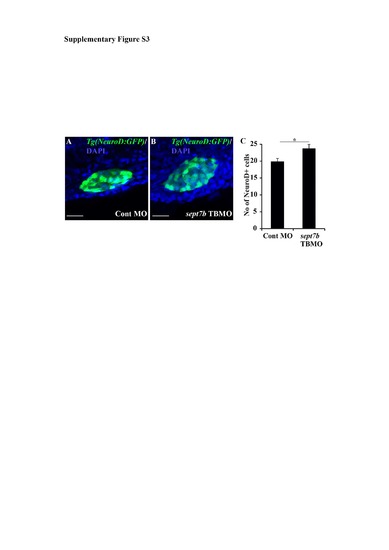
NeuroD-positive endocrine cells are increased in sept7b knockdown larvae. (A-B) NeuroD-positive cells (green) in control MOinjected (A) and sept7b TBMO-injected (B) Tg(neuroD:GFP) zebrafish larvae at 3 dpf. Nuclei are visualized with DAPI (blue). (C) NeuroD-positive cells are increased in sept7b knockdown larva compared to control MO-injected larvae. Error bars represent the standard error of mean. * p? 0.05. Scale bar: A, B (20 ?m). |
|
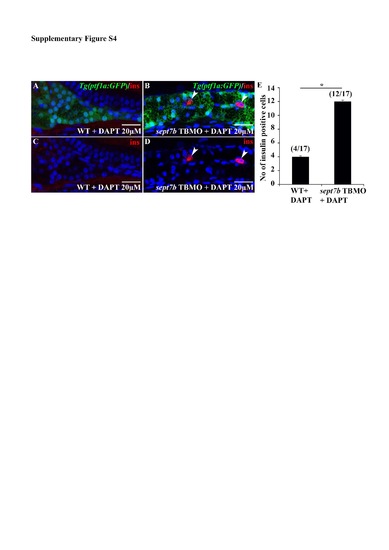
Insulin-positive cells are increased in the intrapancreatic duct (IPD) of sept7b TBMO and DAPT -treated larvae. (A-D) Immunostaining of Tg(ptf1a:GFP) zebrafish larva co-treated with sept7b TBMO and 20 ?M DAPT with antibodies against insulin shows cells positive for insulin (arrowheads) in the IPD (B, D) whereas wild type larva treated with 20 ?M DAPT (A, D) does not. (E) Counting the number of cells positive for insulin revealed that 17 larvae depleted of sept7b and treated with 20 ?M DAPT show altogether 12 cells positive for insulin in the IPD. In 17 wild type larvae treated with 20 ?M DAPT altogether only four cells positive for insulin are observed in the IPD. In all cases, we observed only 0-2 cells/larva positive for insulin. Error bars represent the standard error of mean. * p? 0.05. Scale bar: A-D (25 ?m). |

