
Fig. 6
- ID
- ZDB-FIG-190611-32
- Publication
- Turner et al., 2019 - Abrogation of Stem Loop Binding Protein (Slbp) function leads to a failure of cells to transition from proliferation to differentiation, retinal coloboma and midline axon guidance deficits
- Other Figures
- All Figure Page
- Back to All Figure Page
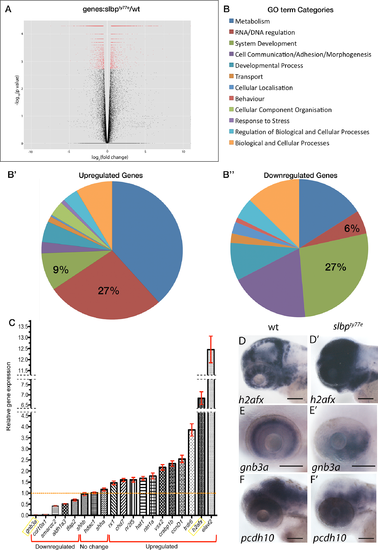
RNAseq analysis reveals that loss of Slbp function induces large-scale changes in gene expression levels consistent with many cells failing to transition to differentiation. (A) Volcano plot displaying differential expressed genes between wildtype and slbpty77eembryos The red dots on the right represent the significant up regulated expressed transcripts (p < 0.01, false discovery rate (FDR) q < 0.01); the red dots on the left represent the transcripts with expression significantly down regulated (p < 0.01, FDR q < 0.01). Non-significant genes (q > 0.01) are represented by a black dot. (B) GO term categories for enriched genes. (B’, B”) Pie charts showing percentages of GO terms relating to each category for up (B) and down (B’)-regulated genes in slbpty77e mutants compared to wildtype. C) Graph showing real time PCR quantification of expression changes for genes selected from the RNAseq dataset. Samples were normalized to β-actin and wildtype values for each gene were set to 1. Fold changes in mutants were plotted relative to this value. (D-F’) Lateral views of 3dpf wildtype (D-F) and slbpty77emutant (D’-F’) heads/eyes showing expression of h2afx (D, D’); gnb3a (E,E’) and pcdh10(F,F’). Note that expression changes for h2afx and gnb3a (C) are consistent with qPCR data (yellow box in C). Scale bars: 100μm. |
| Genes: | |
|---|---|
| Fish: | |
| Anatomical Terms: | |
| Stage Range: | Long-pec to Protruding-mouth |
| Fish: | |
|---|---|
| Observed In: | |
| Stage Range: | Long-pec to Protruding-mouth |