
Fig. 6
|
Fig. 6
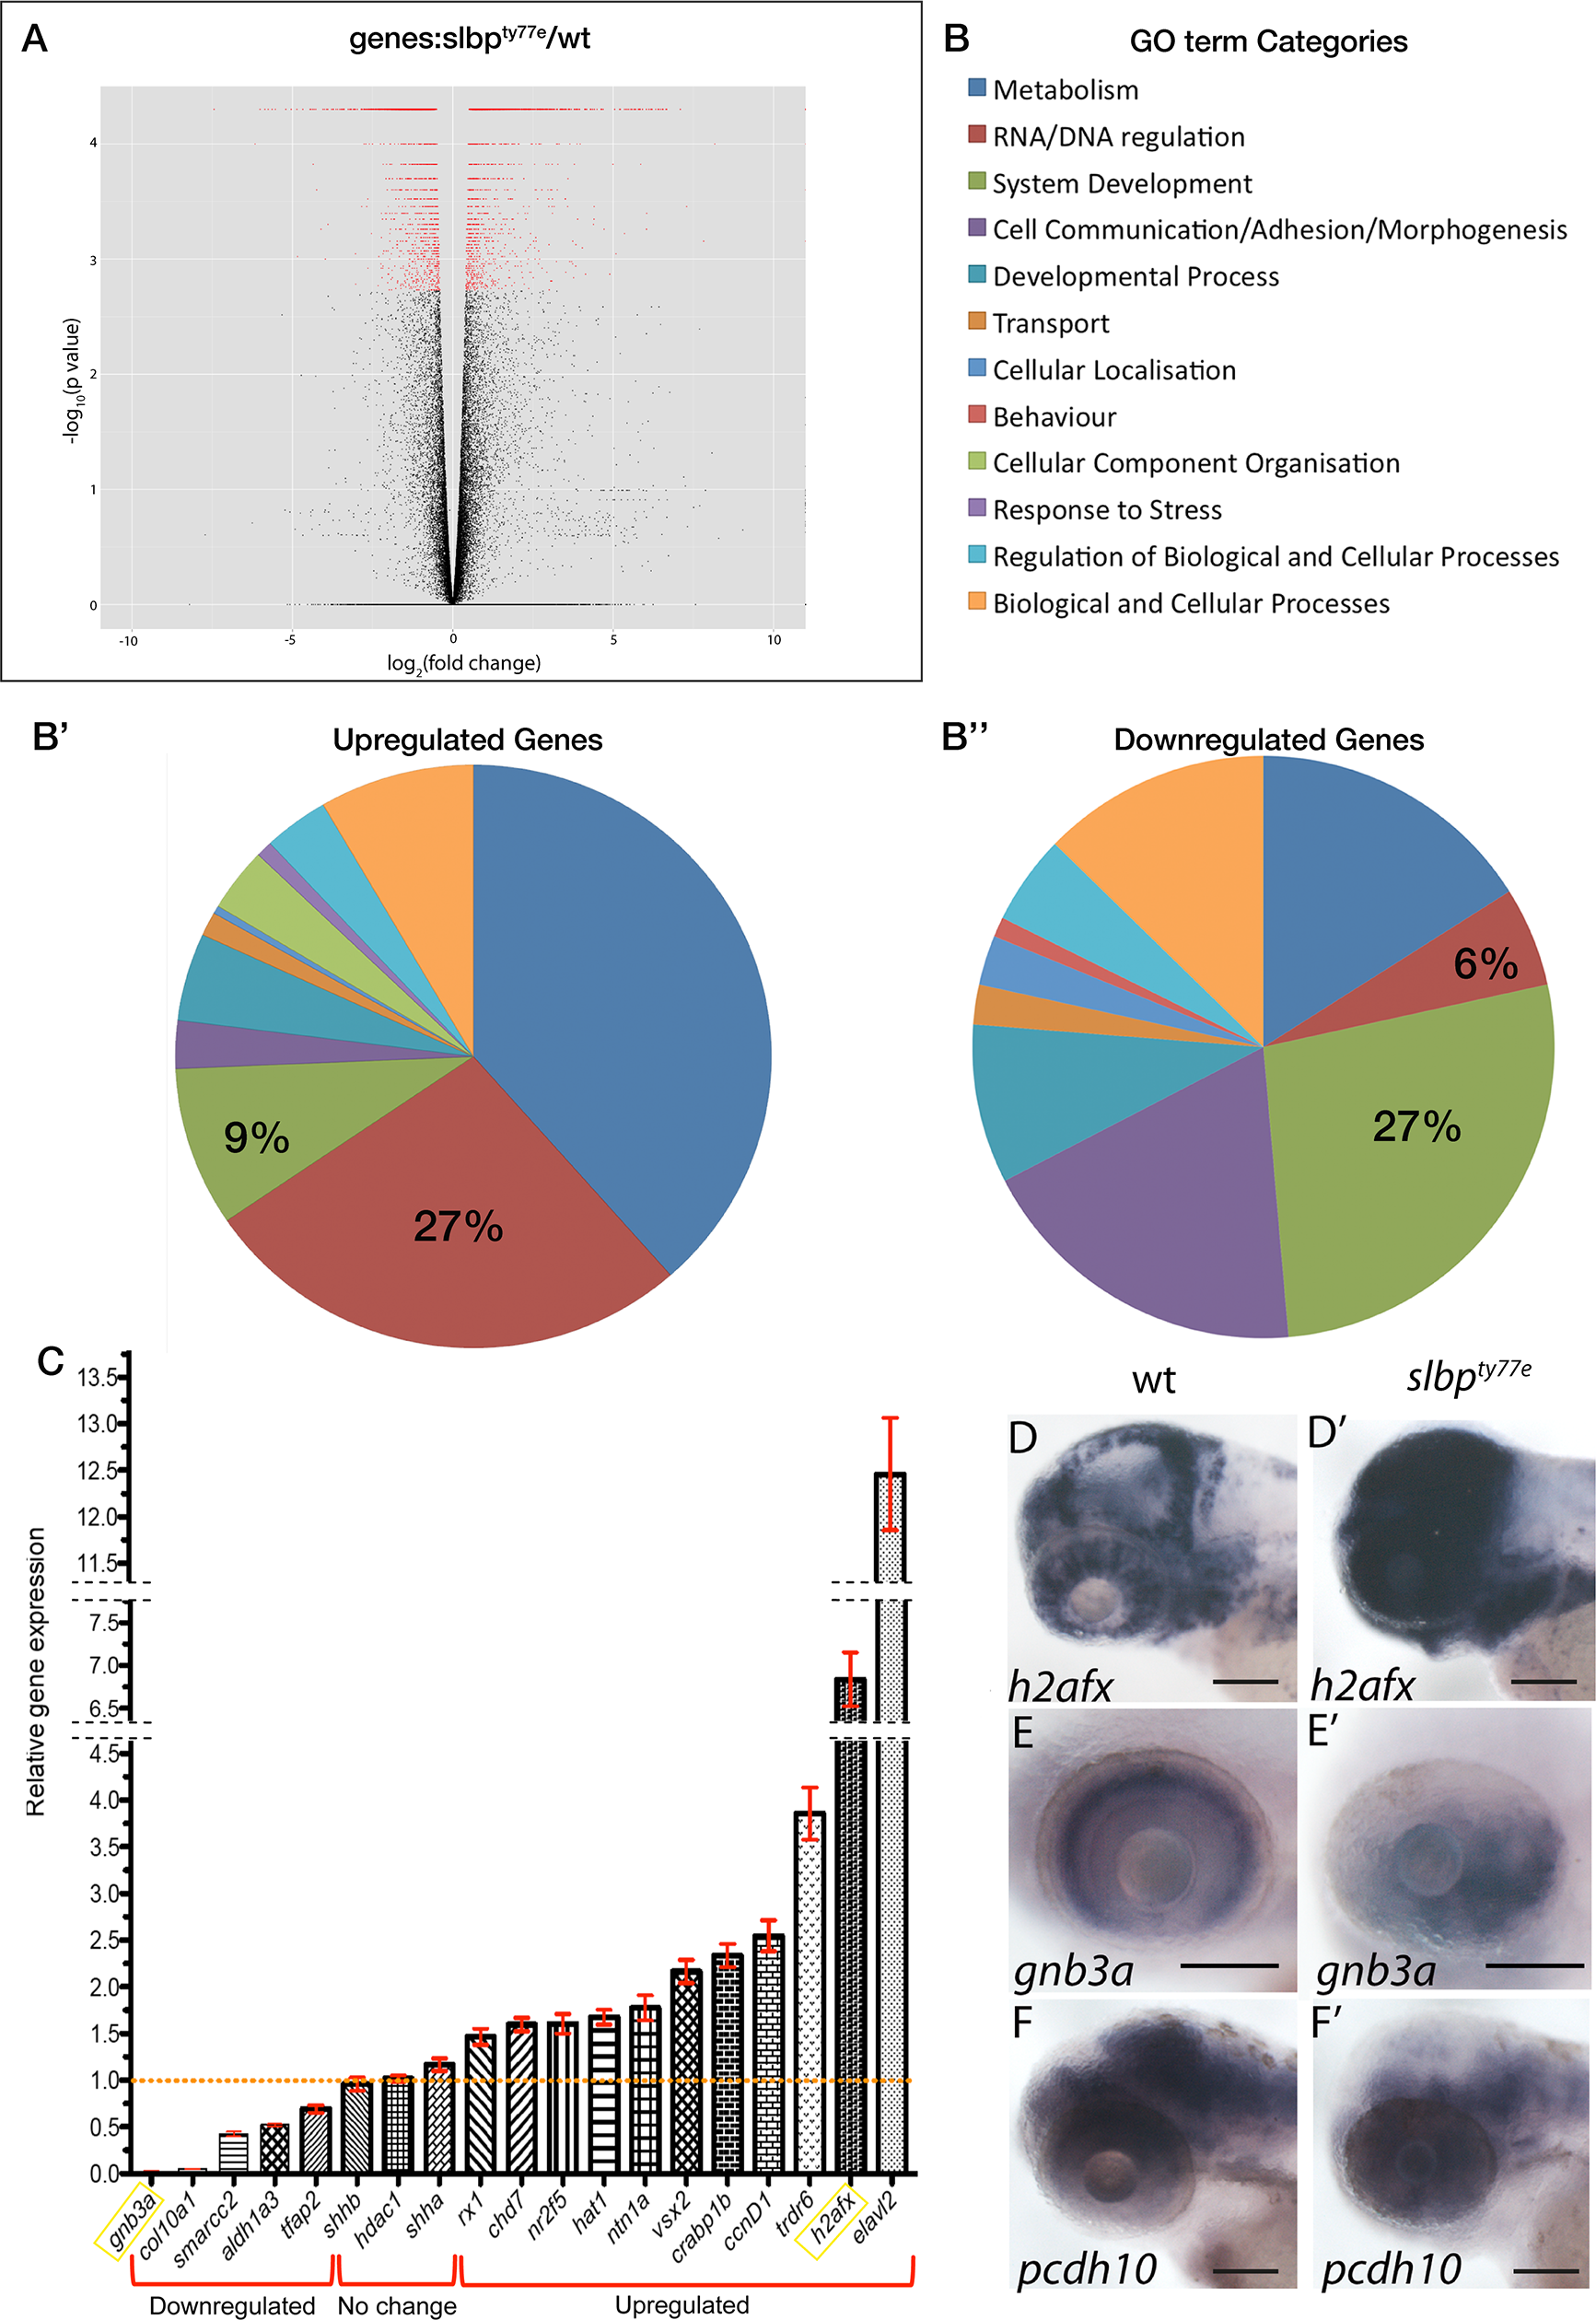
(A) Volcano plot displaying differential expressed genes between wildtype and slbpty77eembryos The red dots on the right represent the significant up regulated expressed transcripts (p < 0.01, false discovery rate (FDR) q < 0.01); the red dots on the left represent the transcripts with expression significantly down regulated (p < 0.01, FDR q < 0.01). Non-significant genes (q > 0.01) are represented by a black dot. (B) GO term categories for enriched genes. (B’, B”) Pie charts showing percentages of GO terms relating to each category for up (B) and down (B’)-regulated genes in slbpty77e mutants compared to wildtype. C) Graph showing real time PCR quantification of expression changes for genes selected from the RNAseq dataset. Samples were normalized to β-actin and wildtype values for each gene were set to 1. Fold changes in mutants were plotted relative to this value. (D-F’) Lateral views of 3dpf wildtype (D-F) and slbpty77emutant (D’-F’) heads/eyes showing expression of h2afx (D, D’); gnb3a (E,E’) and pcdh10(F,F’). Note that expression changes for h2afx and gnb3a (C) are consistent with qPCR data (yellow box in C). Scale bars: 100μm.