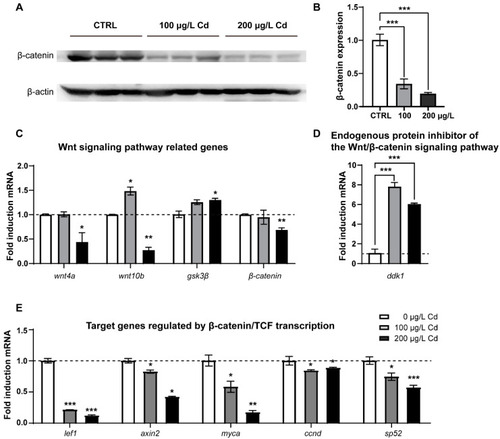
Cd2+ exposure inhibited zebrafish Wnt/β-catenin signaling pathway. (A,B) Western blot analysis and quantitation of β-catenin expression levels in 6 dpf zebrafish larvae exposed to different levels of Cd2+. (CE) qRT-PCR analysis of relative expression of genes involved in Wnt/β-catenin signaling pathway. The values are presented as the mean ± SEM. The results of either nonparametric test or ANOVA followed by multiple comparison test are listed in Table S2. “*” indicates significant differences (* p < 0.05, ** p < 0.01, *** p < 0.001).

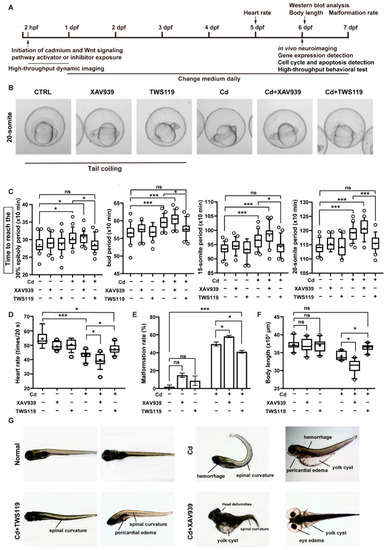
Activation of Wnt signaling pathway attenuated the adverse effects of Cd2+ on zebrafish early development. (A) Schematic design for the following study. (B,C) High-throughput tracking (representative images) of zebrafish early development, and the duration for embryos in different groups to reach certain stages. (DF) Heart rate, rate of deformed individuals, and body length of 6 dpf zebrafish in different groups. (G) Representative morphological characteristics of zebrafish larvae in each group. The values are presented in boxplots (median and mean, whiskers show 90% confidence levels) or in histograms (mean ± SEM). The results of either nonparametric test or ANOVA followed by multiple comparison test are listed in Table S2. “*” indicates significant differences (* p < 0.05, *** p < 0.001).

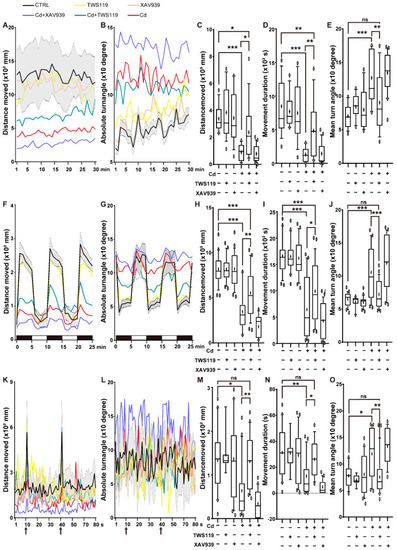
Patterns of zebrafish locomotor activities and reactivity to light–dark/vibration stimulation. Swimming distance, velocity of 6 dpf zebrafish larvae in open field tests (AE), subjected to light–dark cycles (FJ) and vibration stimulation (as indicated by the arrows) (KO). Panels (A,B,F,G,K,L) were plotted in 5 min/10 s time interval, panels (CE,HJ,MO) were plotted with average values of the whole-tracking. Each test was performed at least three times. The numerical values are presented in line charts or boxplots (median and mean, whiskers show 90% confidence levels). The results of either nonparametric test or ANOVA followed by multiple comparison test are listed in Table S2. “*” indicates significant differences (* p < 0.05, ** p < 0.01, *** p < 0.001).

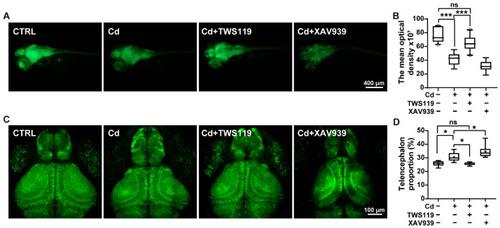
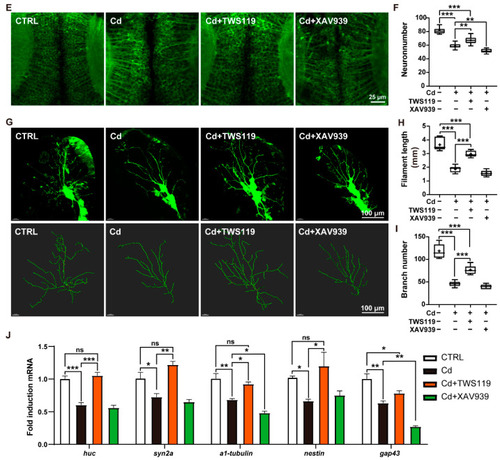
Involvement of zebrafish Wnt signaling pathway in Cd2+-induced neurodevelopmental disorders. (A,B) Fluorescence imaging of 6 dpf Tg(elavl3:EGFP) larvae and statistics of relative fluorescence intensity. (C,D) Confocal fluorescence imaging of the telencephalon and midbrain regions, as well as the statistics of telencephalon proportion. (E,F) Imaging of the PVL region in 6 dpf Tg(elavl3: EGFP) larvae and density statistics of PVN. (GI) Imaging of trigeminal ganglion neurons and structural analysis in 24 hpf zebrafish embryos. (J) Relative expression of genes related to neurodevelopment and differentiation. In histograms, values are represented as mean ± SEM, while in boxplots, values are represented as median and mean, and whiskers show 90% confidence levels. The results of nonparametric test and ANOVA, as well as multiple comparison test are listed in Table S2. “*” indicates significant differences (* p < 0.05, ** p < 0.01, *** p < 0.001).

Involvement of zebrafish Wnt signaling pathway in Cd2+-induced neurodevelopmental disorders. (A,B) Fluorescence imaging of 6 dpf Tg(elavl3:EGFP) larvae and statistics of relative fluorescence intensity. (C,D) Confocal fluorescence imaging of the telencephalon and midbrain regions, as well as the statistics of telencephalon proportion. (E,F) Imaging of the PVL region in 6 dpf Tg(elavl3: EGFP) larvae and density statistics of PVN. (GI) Imaging of trigeminal ganglion neurons and structural analysis in 24 hpf zebrafish embryos. (J) Relative expression of genes related to neurodevelopment and differentiation. In histograms, values are represented as mean ± SEM, while in boxplots, values are represented as median and mean, and whiskers show 90% confidence levels. The results of nonparametric test and ANOVA, as well as multiple comparison test are listed in Table S2. “*” indicates significant differences (* p < 0.05, ** p < 0.01, *** p < 0.001).

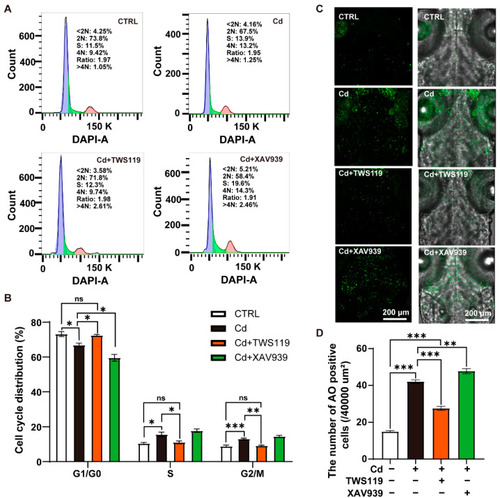
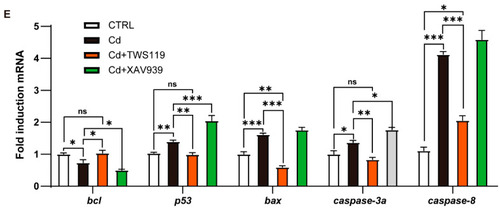
Apoptosis and cell cycle arrest in zebrafish larvae caused by Cd2+ are mediated by Wnt signaling pathway. (A,B) Flow cytometry analysis and distribution of cell cycle phase of neurons and neuronal precursor cells. (C,D) Vertical view in the brain of AO-stained zebrafish larvae (6 dpf) and statistics of apoptotic cell numbers. (E) Relative expression analysis of genes related to cell apoptosis. In histograms, values are represented as mean ± SEM, while in boxplots, values are represented as median and mean, and whiskers signify 90% confidence interval. The results of nonparametric test and ANOVA, as well as multiple comparison test are listed in Table S2. “*” indicates significant differences (* p < 0.05, ** p < 0.01, *** p < 0.001).

Apoptosis and cell cycle arrest in zebrafish larvae caused by Cd2+ are mediated by Wnt signaling pathway. (A,B) Flow cytometry analysis and distribution of cell cycle phase of neurons and neuronal precursor cells. (C,D) Vertical view in the brain of AO-stained zebrafish larvae (6 dpf) and statistics of apoptotic cell numbers. (E) Relative expression analysis of genes related to cell apoptosis. In histograms, values are represented as mean ± SEM, while in boxplots, values are represented as median and mean, and whiskers signify 90% confidence interval. The results of nonparametric test and ANOVA, as well as multiple comparison test are listed in Table S2. “*” indicates significant differences (* p < 0.05, ** p < 0.01, *** p < 0.001).

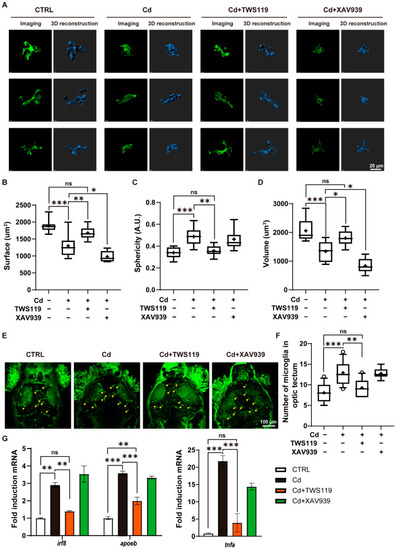
Role of zebrafish Wnt signaling pathway in Cd2+-induced microgliosis and neuroinflammation. (AD) Morphological alterations of microglia in 6 dpf Tg(ApoE-EGFP) zebrafish larvae, and quantification of morphological parameters. (E,F) In vivo neuroimaging and microglia counting in the optic tectum region of 6 dpf zebrafish larvae. (G) Expression patterns of genes closely related with microgliosis and neuroinflammatory response. The numerical values are presented as either mean ± SEM in histograms, or median and mean, while whiskers show 90% confidence levels in boxplots. The results of either nonparametric test or ANOVA followed by multiple comparison test are listed in Table S2. “*” indicates significant differences (* p < 0.05, ** p < 0.01, *** p < 0.001).

Acknowledgments
This image is the copyrighted work of the attributed author or publisher, and ZFIN has permission only to display this image to its users. Additional permissions should be obtained from the applicable author or publisher of the image. Full text @ Int. J. Mol. Sci.