FIGURE SUMMARY
Title

Clinical pathologies of bone fracture modelled in zebrafish

Authors
Tomecka, M.J., Ethiraj, L.P., Sánchez, L.M., Roehl, H.H., Carney, T.J.
Source
Full text @ Dis. Model. Mech.

Phases of bone crush fracture repair in the adult zebrafish fin. (A-E) Fluorescent (A,D) and brightfield (B,C,E) images of mpx:egfp (A), Alcian Blue (B), Alizarin Red (C,D) and TRAP (E) labelling of lepidotrichia crush fractures at different stages of repair. Unfractured stainings are shown for reference. GFP-positive neutrophils (A), soft callus (B), hard callus (C,D) and osteoclast remodelling (E) have distinct temporal properties during repair. Fluorescent imaging of the bone callus (D) demonstrates the presence of a bone collar surrounding the callus. Relative callus width was measured by dividing the width of callus by the width of adjacent lepidotrichia (a/b) (D). Crush positions in A and D are circled; ray segment is outlined by a box in A. (F) Scheme showing the stages of repair. Scale bars: 100 µm. mpc, minutes post crush.

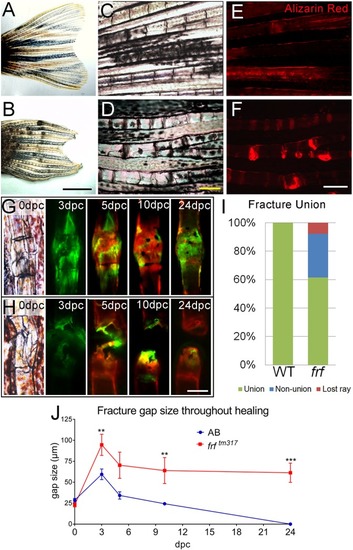
Non-union fractures in a zebrafish OI model. (A-D) Brightfield images at low (A,B) and high (C,D) magnification of adult fins at 3 months post fertilisation, showing thickening and dark foci in frf mutants (B,D) compared with WT (A,C). (E,F) Magnified images of WT (E) and frf (F) foci stained with Alizarin Red demonstrates bone calluses at these sites, indicating fractures. (G,H) Brightfield and fluorescent images of induced fractures in WT (G) and frf (H) at the indicated dpc. Bone was alternately stained with calcein (green) or Alizarin Red (red) to visualise callus growth. (I) A proportion of induced fractures in frf were non-union; n=12 per genotype. (J) The gap size following fracture was not reduced compared with WT over time; n=12 per point. **P<0.01, ***P<0.001; ANOVA with Sidak post test. Scale bars: in B, 2 mm for A,B; in D and F, 200 µm for C-F; in H, 100 µm for G,H.

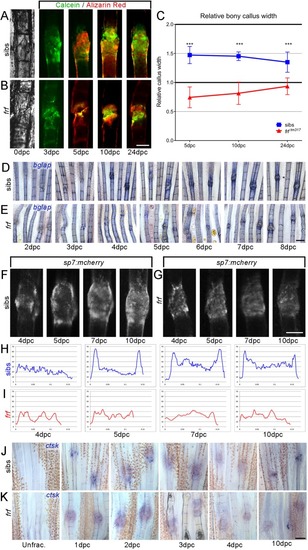
Abnormal bone callus architecture in zebrafish OI fractures. (A,B) Brightfield and fluorescent images of induced fractures in WT siblings (A) and frf (B) (at the dpc indicated) that underwent unification. Bone was alternately stained with calcein (green) or Alizarin Red (red) to visualise callus growth. (C) Bone callus formation in frf was delayed in comparison with WT, with relative callus width much lower at all stages measured (n=16 per time point). (D-G) Labelling of osteoblasts in induced fractures of frf (E,G) and siblings (D,F) at the indicated dpc, using in situ hybridisation for bglap (osteocalcin) (D,E) and confocal imaging of sp7:mcherry (F,G). No overt change in osteoblast recruitment was observed. (H,I) Intensity plots of mCherry fluorescence across the callus of sample images of WT (H) and frf (I) fractures, as measured from F,G. Osteoblasts did not form a marked collar around the callus and were more homogeneous across the callus in frf. (J,K) ctsk in situ labelling of osteoclasts in frf (K) and sibling (J) fin rays unfractured or following crush. Osteoclasts were present in both siblings and mutants following crush injury. ***P<0.001; ANOVA with Tukey post test. Scale bars: in B and G, 100 µm for A,B,F,G; in E and K, 200 µm for D,E,J,K.

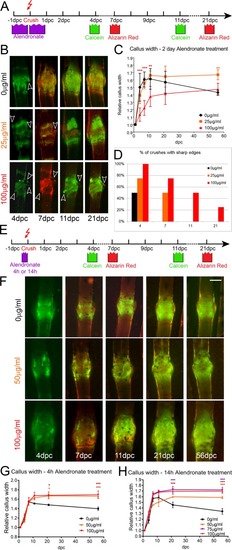
Bisphosphonate treatment alters bone callus resorption dynamics. Effect of extended and pulse exposure to alendronate on fracture bone callus. (A,E) Outlines of experimental regimes for extended (A) and pulse (E) treatment of fractures with alendronate and subsequent imaging. Fish were either treated for 1 day either side of the fracturing (A) or for a 4 h or 14 h pulse prior to fracturing (E). (B,F) Fluorescent images of fractures treated with indicated dose of alendronate following extended (B) or pulse (F) exposure as per regimes in A and E, respectively. The time points following crush are given. Arrowheads indicate bone debris. (D) Percentage of crushes showing bone debris (n=8 per point). (C,G,H) Relative callus width measurements at different time points for fractures treated with 25, 50, 75 or 100 µg/ml alendronate compared with untreated fractures for extended exposure (C), 4 h pulse pretreatment (G) or 14 h pulse pretreatment (H). Both alendronate concentration and time affected callus formation or resorption (n=4 per point). **P<0.01, ***P<0.001; ANOVA with Tukey post test. Scale bar: in F, 100 µm for B,F.

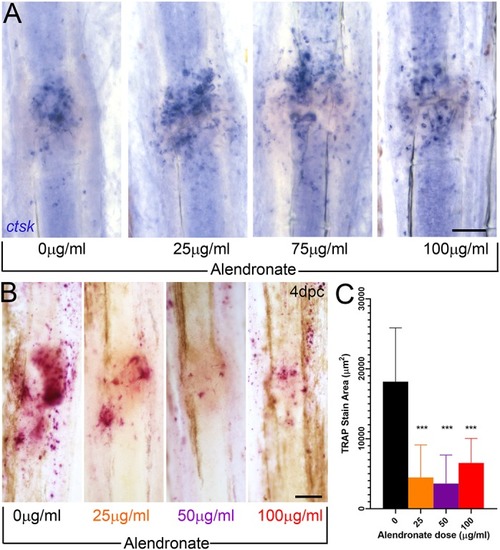
Alendronate reduces osteoclast activity but not numbers at the fracture. (A) Images of fractures processed by in situ hybridisation for ctsk to label osteoclasts at the fracture site at 1 dpc, following 14 h pulse exposure to various concentrations of alendronate, as shown. (B) TRAP staining performed at 4 dpc, following 14 h alendronate treatment at various concentrations immediately prior to fracture. (C) Reduced areas of TRAP staining were quantified (n=12). ***P<0.0001; ANOVA with Tukey post test. Scale bars: 100 µm.

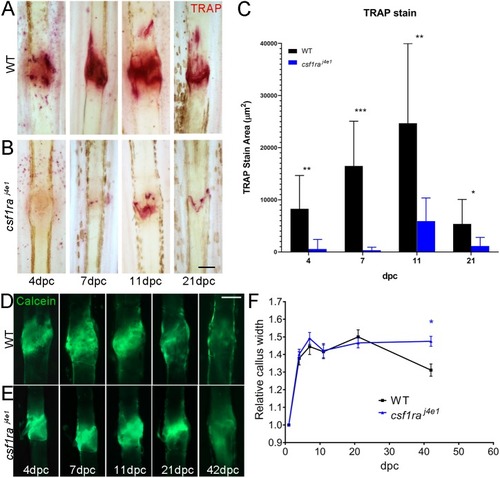
Genetic ablation of osteoclasts reduces bone callus resorption. (A,B) TRAP staining of fractures in WT (A) and csf1raj4e1 mutants (B) at given time points following crush. (C) The area of TRAP staining was significantly reduced in the mutants at all time points (n=12). (D,E) Fluorescent images of WT (D) and csf1raj4e1 mutant (E) fractures stained with calcein. The time points following crush are given. (F) Relative callus width measurements at different time points for fractures of WT and csf1ra mutants at given time points (n=15). By 42 hpc, the mutants had significantly fewer remodelled calluses. *P<0.05, **P<0.01, ***P<0.001; ANOVA with Sidak post test. Scale bars: in B and D, 100 µm for A,B,D,E.

Alendronate reduces fractures in the zebrafish OI model. (A) Outline of experimental regime for cyclical treatment of frf with 50 µg/ml alendronate and subsequent imaging of fins for spontaneous fracture occurrence. (B-D) Brightfield images of tail fins of frf fish at 11 weeks post fertilisation (wpf), either untreated and directly imaged (B), cyclically immersed in 50 µg/ml alendronate twice a week (3 h each day) for 3 weeks (D) or sham treated, where fish were immersed in normal tank water to recapitulate handling of the OI fish (C). (E) Number of spontaneous fractures observed was counted at both 11 wpf and 13 wpf (n=7 per point; Mann–Whitney test). (G) Outline of experimental regime for cyclical treatment of frf with 50 µg/ml alendronate, fracturing and subsequent imaging of fins following alternate staining with calcein (green) or Alizarin Red (red) to visualise callus growth. (H,I) Fluorescent images of frf fractures either treated with 50 µg/ml alendronate (I) or untreated (H) and imaged for calcein or Alizarin Red at the indicated time points. (J) The relative bone callus width was compared, but no difference in callus growth was noted upon treatment with alendronate (n=8 per point). *P<0.05; ANOVA with Tukey post test. Scale bars: in D, 2 mm for B-D; in I, 100 µm for H,I.

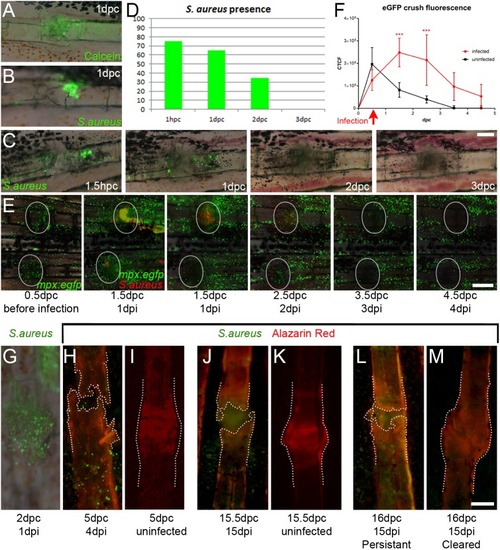
S. aureus infection of fractures delays healing. (A-C) Fluorescent images overlying Nomarski images of either calcein tracer (A) or eGFP-labelled S. aureus (B,C), showing that both can be successfully introduced to a fracture site. (D) Injection of 0.5 nl of 2500 cfu/nl S. aureus yielded detectable bacteria up to 3 dpi (n=20 per point). (E) Fluorescent images of mpx:egfp-positive neutrophils (green) and mCherry-expressing S. aureus (red) over 4 days of infection introduced 12 h after crushing. (F) Inflammation correlates with the presence of S. aureus and prolongs inflammatory response at the fracture (n=4 per point). ***P<0.001; ANOVA with Sidak post test. (G-M) Fluorescent images of eGFP-expressing S. aureus introduced either 12 (J) or 24 h (G,H,L,M) following fracture and viewed with either Nomarski optics (G) or with fluorescence for Alizarin Red (H-M). (I,K) Corresponding uninfected fracture controls are shown. Outlines indicate bone stained by Alizarin Red, showing that the presence of S. aureus predicts poor callus formation compared with uninfected controls (I,K) or where the infection has been cleared (M). Scale bars: in C and G, 100 µm for A-C,G-M; E, 200 µm.

Acknowledgments
This image is the copyrighted work of the attributed author or publisher, and ZFIN has permission only to display this image to its users. Additional permissions should be obtained from the applicable author or publisher of the image. Full text @ Dis. Model. Mech.