- Title
-
RNA polymerase III component Rpc9 regulates hematopoietic stem and progenitor cell maintenance in zebrafish
- Authors
- Wei, Y., Xu, J., Zhang, W., Wen, Z., Liu, F.
- Source
- Full text @ Development
|
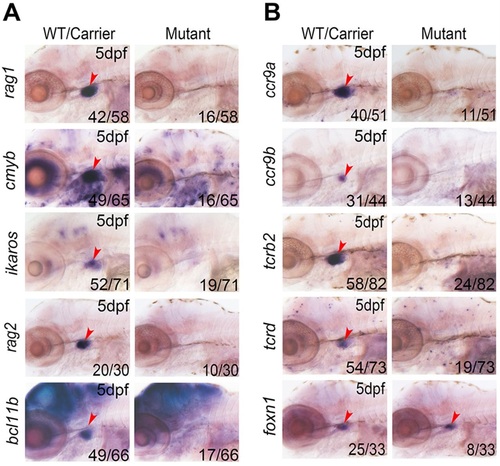
T cells are absent in mutant line 116 embryos. (A,B) WISH showing that early T cell markers (rag1, rag2 and bcl11b), HSPC markers (cmyb and ikaros) and T cell markers (ccr9a, ccr9b, tcrb2 and tcrd) are absent in the thymus of mutant line 116 at 5dpf. By contrast, thymus epithelial cell marker foxn1 was normal in the thymus of 116 mutants at 5dpf. Red arrowheads indicate the thymus. Numbers at bottom right indicate the number of embryos with similar staining pattern among all embryos examined. |
|
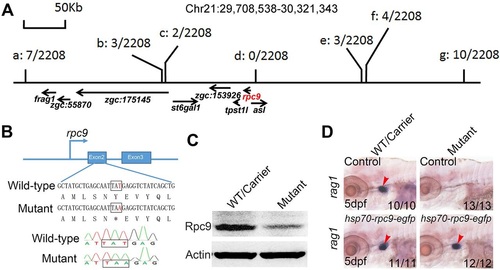
Lack of Rpc9 is responsible for the phenotype of mutant line 116 embryos. (A) Schematic of positional cloning. a-g indicate the locations of polymorphic primers distributed between 29,708,538 to 30,321,343bp of chromosome 21 and the ratios of recombination out of total 2208 embryos in each position. Genes scattered in this region are marked and rpc9 (in red) is adjacent to the polymorphic marker d. Note that the chromosomal locations and sequences of these primers are listed in Table S3. (B) Gene sequencing identified a transversion of T>A in the second exon (exon 2) of rpc9, which formed a pre-mature stop code in the coding region of rpc9 in mutant line 116 embryos. (C) Western blot showed that the protein level of Rpc9 was greatly decreased in mutants at 4dpf. (D) Injection of the rpc9 overexpression plasmid driven by hsp70 promoter (hsp70-rpc9-egfp) exerted a full rescue effect of rag1. Red arrowheads in D indicate the thymus. |
|
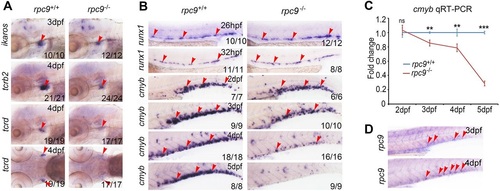
HSPCs are impaired in rpc9-/- embryos. (A) WISH showing that ikaros, at 3dpf, and tcrd and tcrb2, at 4dpf, were decreased in the thymus of rpc9-/- embryos. (B) WISH demonstrates that runx1 expression is not decreased in the AGM region of rpc9-/- embryos at 32 h post-fertilization (hpf) and cmyb clearly begins to decrease from 3dpf in the CHT region of rpc9-/- embryos. (C) qRT-PCR with the cDNA reverse transcribed from total RNA of posterior trunk region reveals that cmyb expression is significantly decreased in rpc9-/- embryos from 3 to 5dpf. β-actin was used as internal control (meanąs.d., n=3, **P<0.01, ***P<0.001). (D) Expression pattern of rpc9 in the CHT region at 3 and 4dpf. Note that arrowheads in A mark the thymus, whereas arrowheads in B,D mark the CHT. Values are meanąs.e.m.; **P<0.01, ***P<0.001, Student′s t-test. ns, not significant. PHENOTYPE:
|
|
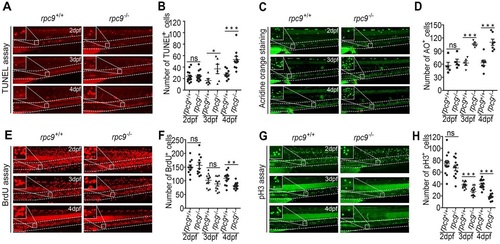
Enhanced apoptosis and reduced proliferation in the CHT of rpc9-/- mutants. (A,B) TUNEL assay shows apoptosis signals in the CHT region of rpc9+/+ and rpc9-/- embryos. TUNEL signals are significantly enhanced in rpc9-/- embryos at 3 and 4dpf, but not at 2dpf. (C,D) Acridine Orange (AO) staining shows that rpc9-/- embryos display more intensive apoptosis signals in the CHT region than rpc9+/+ embryos at 3 and 4dpf. Note that asterisk indicates the cloaca where unspecific spots were not taken into account when quantifying the apoptosis signals. (E,F) BrdU assay reveals that proliferation is affected in rpc9-/- embryos at 4dpf compared with rpc9+/+ embryos. (G,H) pH3 assay demonstrates the pH3 proliferation signals are significantly reduced in rpc9-/- embryos at 3 and 4dpf compared with rpc9+/+ embryos. Note that white dashed boxes in A,C,E and G enclose the CHT region where the signal spots (indicated by white arrowheads) were counted. A 3× magnified image is shown in the top left corner of each panel. Values are meanąs.e.m.; *P<0.05, **P<0.01, ***P<0.001, Student′s t-test. ns, not significant. PHENOTYPE:
|
|
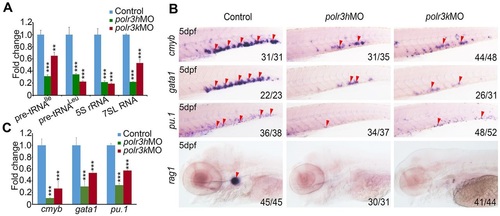
Knockdown of Pol III components polr3h and polr3k leads to HSPC defects. (A) qRT-PCR result shows that, compared with control embryos, products of Pol III (pre-tRNAIle, pre-tRNALeu, 5S rRNA and 7SL RNA) are all significantly decreased in both polr3h and polr3k morphants (5dpf). 18S rRNA was used as internal control. (B) WISH result showing that HSPC marker (cmyb) and differentiated hematopoietic cell lineage markers (gata1, pu.1 and rag1) are all decreased in polr3h and polr3k morphants at 5dpf. (C) qRT-PCR result reveals that cmyb, gata1 and pu.1 are significantly decreased in polr3h and polr3k morphants at 5dpf. β-actin was used as internal control. Note that arrowheads in B mark the CHT or the thymus. Values are meanąs.d. **P<0.01, ***P<0.001, Student′s t-test. |
|
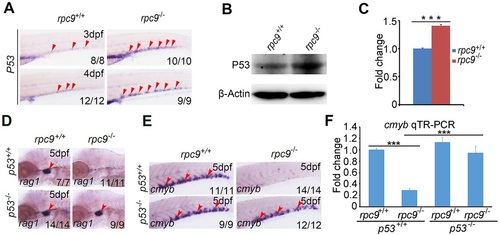
P53 mediates the regulation of Rpc9 in HSPC survival. (A) WISH result reveals that p53 is specifically increased in the CHT region of rpc9-/- embryos at 3 and 4dpf. (B) Western blot shows that, compared with rpc9+/+ embryos, the protein level of P53 was greatly increased in rpc9-/- embryos at 4dpf. (C) The quantitative result of the western blot in B. (D) The absence of rag1 in the thymus of rpc9-/- embryos, at 5dpf, can be rescued by loss of p53. (E) The absence of cmyb in the CHT region of rpc9-/- embryos at 5dpf can be rescued by p53 deficiency. (F) qRT-PCR result reveals that the decrease of cmyb in the CHT region of rpc9-/- embryos at 5dpf can be rescued by loss of p53. Note that arrowheads in A,E mark the CHT, whereas arrowheads in D mark the thymus. Values are meanąs.e.m. ***P<0.001, Student′s t-test. EXPRESSION / LABELING:
PHENOTYPE:
|
|
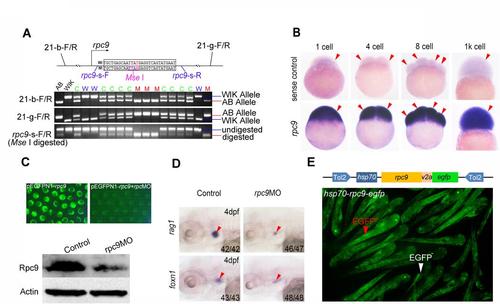
The positional cloning result and the validation of candidate gene for 116 mutants. (A)A schematic of the mutated region was drawn and the newly generated restriction enzyme recognition site (MseI) was encircled with a purple box. Polymorphic primers (21-B-F/R and 21-G-F/R) and primers for rpc9 gene (rpc9-s-F/R, embracing Mse I) that used for genotyping were marked at their corresponding locations (Upper panel).The PCR results of 116 mutants screen with 21-B-F/R and 21-G-F/R, or with rpc9-s-F/R and then digested with Mse I (Lower panel). Note that the chromosomal locations and sequences of these primers are listed in Table S.3. AB represents AB strain (116 mutant carrier) grandparent and WIK represents WIK strain grandparent (wild-type). W, wild-type.M, mutant.C, mutant carrier. (B)WISH result demonstrated the maternal expression pattern of rpc9. Arrowheads mark the cell of zebrafish embryos. (C)The validation of rpc9 MO. Compared to the embryos injected with pEGFPN1-rpc9,EGFP signal in embryos co-injected with pEGFPN1-rpc9 and rpc9 MO was dramatically blocked(upper panel). Western blot showed that the protein level of Rpc9 in rpc9 morphants was remarkably lower than that of the control (lower panel). (D)The expression pattern of rag1 and foxn1 in rpc9 morphants. Red arrowheads mark the thymus.(E)rpc9 overexpression plasmid that driven by hsp70 promoter (hsp70-rpc9-egfp)and embryos injected with this plasmid showed effective EGFP expression after heat-shock. Red arrowhead marks GFPhigh embryos while white arrowhead marks GFPlow embryo. |
|
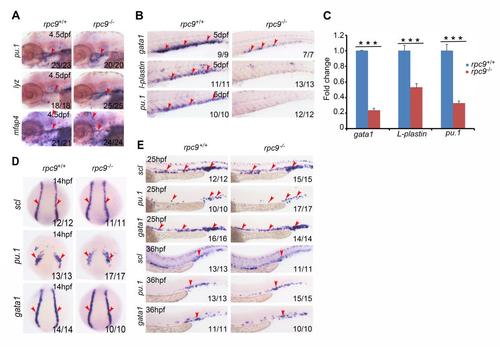
Hematopoietic cells are affected at 5 dpf but not at early stage in rpc9-/- embryos. (A) WISH result demonstrated the expression pattern of pu.1, lyz and mfap4 in the thymus of rpc9-/- or rpc9+/+ embryos at 4.5 dpf. Red arrowheads mark the thymus. (B) WISH result demonstrated that, compared to that of rpc9+/+ embryos, gata1, l-plastin and pu.1 were severely decreased in the CHT region of rpc9-/- embryos at 5 dpf. Arrowheads mark the CHT. (C) qRT-PCR result revealed that, compared with rpc9+/+ embryos, gata1, l-plastin and pu.1 were all significantly decreased in rpc9-/- embryos, at 5dpf. β-actin was used as internal control (meanąSD, ***P0.001). (D) WISH result demonstrated that, compared to that of rpc9+/+ embryos, scl, gata1 and pu.1 were not obviously altered in rpc9-/- embryos at 10 somite stage. Arrowheads mark the ALM(anterior lateral mesoderm) or PLM (posterior lateral mesoderm)region of zebrafish embryos. (E) WISH result demonstrated that, compared to the rpc9+/+ embryos, scl, gata1 and pu.1 in rpc9-/- embryos were not obviously altered at 25 and 36 hpf. Arrowheads mark the AGM or the CHT region. |
|
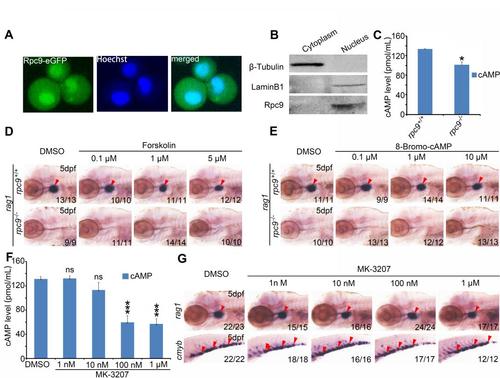
The hematopoietic defects of rpc9-/- mutants are independent of calcitonin signaling pathway. (A) Confocal imaging showed that Rpc9-EGFP fusion protein was enriched in the nucleus rather than the membrane of embryonic zebrafish cells at 9 hpf. (B) Western blot assay confirmed Rpc9 in the nucleus. β-Tubulin, cytoplasmic proteinmarker. LaminB1, nuclear proteinmarker. (C) The cAMP level of rpc9-/- embryos was slightly lower than that of rpc9+/+ embryos (meanąSD, *P < 0.05). (D) The absence of rag1 in the thymus of rpc9-/- embryos was not rescued by Forskolin administration. (E) 8-Bromo-cAMP treatment could not restore the T cell defects in rpc9-/- mutants. (F) MK-3207 treatment led to a significant decrease of cAMP level (meanąSD, *** < P0.001). (G) Embryos treated with MK-3207 showed no obvious T cell or HSPC defects. Note that arrowheads in (D), (E) and (G) mark the thymus or the CHT. |
|
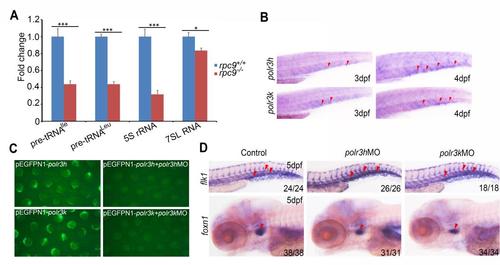
The decreased products of Pol III in rpc9-/- mutants, the expression pattern of polr3h and polr3k and the evaluation of their morpholinos. (A) qRT-PCR revealed that, compared to rpc9+/+embryos, the level of pre-tRNAIle, pre-tRNALeu, 5S rRNA and 7SL RNA was significantly decreased in rpc9-/-embryos at 5 dpf (meanąSD, *P < 0.05, ***P < 0.001). (B) The expression profiles of polr3h and polr3k. (C) The EGFP signal in zebrafish embryos injected with pEGFPN1-polr3h, or embryos co-injected with pEGFPN1-polr3h and polr3h MO (upper panel); The EGFP signal in zebrafish embryos injected with pEGFPN1-polr3k, or embryos co-injected with pEGFPN1-polr3k and polr3k MO (lower panel); (D) The expression pattern of flk1 at 36 hpf and foxn1 at 5 dpf in control embryos, polr3h and polr3k morphants. EXPRESSION / LABELING:
|
|
Inhibition of Pol III function leads to HSPC defects. (A) qRT-PCR demonstrated that, compared to DMSO treated embryos, products of Pol III (pre-tRNAIle, pre-tRNALeu, 5S rRNA, 7SL RNA) were all significantly decreased in embryos at 5 dpf treated with ML-60218 (Pol III inhibitor). 18S rRNA was used as internal control (meanąSD, ***P < 0.001). (B) WISH result showed the expression pattern of vascular marker flk1, HSPC marker cmyb, differentiated hematopoietic cell lineage markers (gata1, pu.1 and rag1) and thymus epithelial cell marker foxn1 in DMSO or ML-60218 treated embryos. (C) qRT-PCR result revealed that cmyb, gata1, and pu.1 were decreased in embryos treated with ML-60218. β-actin was used as internal control (meanąSD, **P < 0.01, ***P < 0.001). Note that arrowheads in (B) mark the CHT or the thymus. |
|
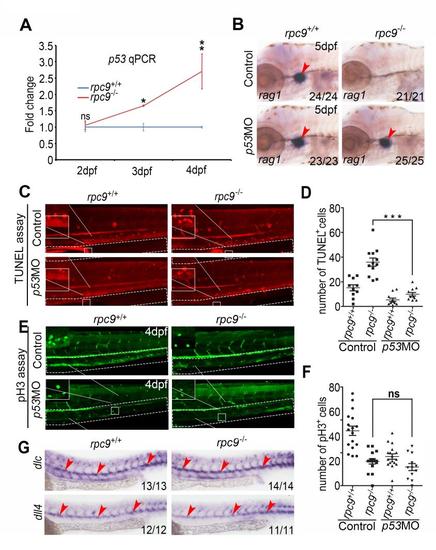
The absence of rag1 and excessive apoptosis in rpc9-/- embryos can be rescued by knockdown of P53. (A) qRT-PCR result revealed that p53 was significantly increased in rpc9-/- embryos at 3 and 4 dpf. β-actin was used as internal control (meanąSD, *P < 0.05, **P < 0.01) . (B) WISH result demonstrated the decrease of rag1 in the thymus of rpc9-/- embryos at 5 dpf could be rescued by p53-deficiency. Arrowheads mark the thymus. Arrowheads mark the thymus. Arrowheads mark the thymus. Arrowheads mark the thymus. Arrowheads mark the thymus. Arrowheads mark the thymus. Arrowheads mark the thymus. Arrowheads mark the thymus. Arrowheads mark the thymus. Arrowheads mark the thymus. Arrowheads mark the thymus. Arrowheads mark the thymus. Arrowheads mark the thymus. Arrowheads mark the thymus. Arrowheads mark the thymus. Arrowheads mark the thymus. Arrowheads mark the thymus. Arrowheads mark the thymus. Arrowheads mark the thymus. (C) TUNEL assay demonstrated apoptosis in the CHT of rpc9+/+ and rpc9-/- embryos that injection with control or p53 MO at 4 dpf. (D) Statistical data of (C) revealed that apoptosis signals in rpc9-/- embryos could be significantly repressed by injection of p53 MO at 4 dpf (meanąSEM, ***P < 0.001). (E) pH3 assay demonstrated proliferation in the CHT of rpc9+/+ and rpc9-/- embryos that injection with control or p53 MO at 4 dpf. (E) Statistical data of (F) revealed that proliferation signals were not significantly altered between rpc9-/- embryos that injected with control or p53 MO at 4 dpf (meanąSEM, ns, no significant). (G) WISH showed no obvious alteration of expression of arterial markers dlc and dll4 in rpc9-/- embryos. |

