
- Title
-
Cross-species single-cell RNA-seq analysis reveals disparate and conserved cardiac and extracardiac inflammatory responses upon heart injury
- Authors
- Cortada, E., Yao, J., Xia, Y., D�ndar, F., Zumbo, P., Yang, B., Rubio-Navarro, A., Perder, B., Qiu, M., Pettinato, A.M., Homan, E.A., Stoll, L., Betel, D., Cao, J., Lo, J.C.
- Source
- Full text @ Commun Biol
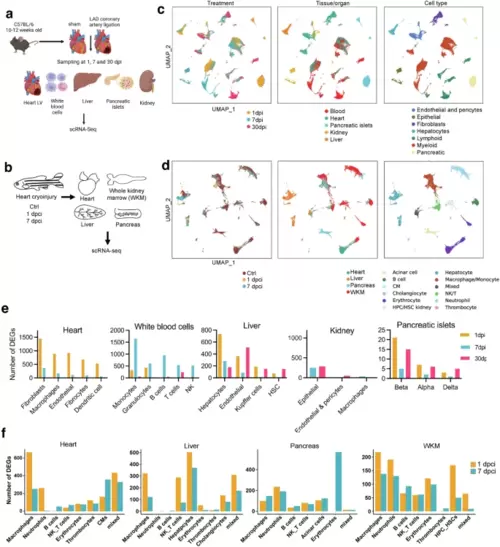
Multiorgan response to cardiac injury in mouse and zebrafish by scRNA-Seq.Experimental outline for mouse (a) or zebrafish (b) heart injury and sampling for scRNA-seq analysis. A scRNA-seq analysis was done per sample, for a total of 28 murine samples (5 tissues, 3 timepoints except for the kidney which were analyzed at 7 and 30 dpi, and 2 conditions, sham and MI. Each sample included cells from one or two biological replicates combined 1:1). 24 zebrafish samples (4 tissues, 3 conditions, and 2 biological replicates) were included. a was created with BioRender. c UMAPs (Uniform manifold approximation and projection) of the 194,315 cells (from 41 mice; 22 sham and 19 MI) colored by timepoint (left), tissue of origin (center) and cell type (right). Dpi, days post infarction. d UMAP of 70,783 zebrafish cells showing treatments timepoints (left), tissue of origin (center) and cell type (right). Dpci, days post cardiac injury; WKM, whole kidney marrow; Ctrl, uninjured. Bar plot of DEGs (MI compared to sham procedure) in mice (e) and zebrafish (f) by tissue and cell type. Bars are colored by timepoint. Genes with FDR < 0.05 and absolute log2(FC) > 0.25 were considered differentially expressed. |
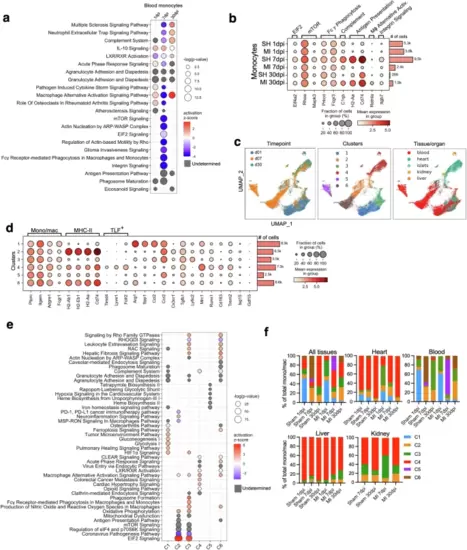
Dynamic cardiac and extracardiac mono/M? subcluster response to myocardial injury in mice.a Dot plot depicting enriched pathways in monocytes at 1, 7, and 30 days post infarction (dpi). b Dot plot shows gene expression in blood monocytes by experimental group (MI or SH) and timepoint. c UMAPs of all 37,215 sequenced mono/M? reclustered, colored by timepoint (left), cluster (center) and tissue of origin (right). d Dot plot shows normalized gene expression (dot color intensity) across all analyzed mono/M? clusters, regardless of tissue, timepoint and sham or MI procedure. Common mono/M? marker genes and MHC-II and TLF (Timd4, Lyve1 and Folr2) genes are indicated. e Dot plot depicting enriched pathways in mono/M? cell subclusters, regardless of tissue of origin, timepoint or sham/MI. f Stacked column plot shows percentage of the 6 murine subclusters (C1-C6) of total mono/M? by condition, timepoint and tissue. In (a) and (e) Dot size represents statistical significance of enrichment, dot color represents z-score. Positive z-score predicts activation of the pathway in the MI compared to the sham group and negative z-score predicts inhibition of the pathway in the MI compared to the sham group. Gray dots denote undetermined activation status. In (b) and (d): Color intensity in dot plots represents normalized mean expression, dot size represents fraction of cells expressing the gene. |
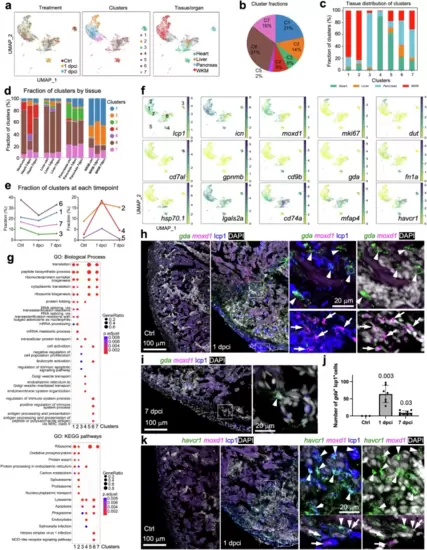
Mono/M? response to cryoinjury in zebrafish.a UMAPs of 10,709 reclustered mono/M?, colored by treatment group (Ctrl, 1 dpci, or 7 dpci; left), cluster (center) and tissue of origin (right). WKM, whole kidney marrow; Ctrl, uninjured; dpci, days post heart cryoinjury. b Fractions of each subcluster over total macrophages and monocytes. Tissue distribution of each mono/M? subcluster grouped by cluster (c) or tissue and treatment group (d). e Dynamics of subcluster fractions over total mono/M? in each treatment group (Ctrl, 1 dpci, or 7 dpci) across three groups. f UMAPs showing expression patterns of selected marker genes. g Enriched biological process terms (top) and KEGG pathway (bottom) for the subcluster markers (mean AUC > 0.6). The gene ratio is indicated by the dot size and the significance by the color of the dot (P < 0.05). h, i, Images of heart cryosection showing HCR staining signals of gda in green and moxd1 in magenta in Ctrl (uninjured), 1 dpci, and 7 dpci samples. Anti-lcp1 staining is shown in blue. DAPI staining is shown in white. The framed regions are enlarged to show details on the right with different channel combinations. Arrowheads and arrows indicate representative gda+lcp1+ and moxd1+lcp1+ cells, respectively. Scale bar, 100 ?m. j Quantification of gda+lcp1+ cells in the wound in Ctrl (uninjured), 1 dpci, and 7 dpci samples. n = 3 (Ctrl), 7 (1 dpci), and 8 (7 dpci). Mean � S.D. Student?s t-test versus the control. k Images of heart cryosection showing HCR staining signals of havcr1 and moxd1 at 1 dpci in green and magenta, respectively. Anti-lcp1 staining is shown in blue. DAPI staining is shown in white. The framed regions are enlarged to show details on the right with different channel combinations. Arrowheads and arrows indicate representative havcr1+lcp1+ and moxd1+lcp1+ cells, respectively. Scale bar, 100 ?m. |
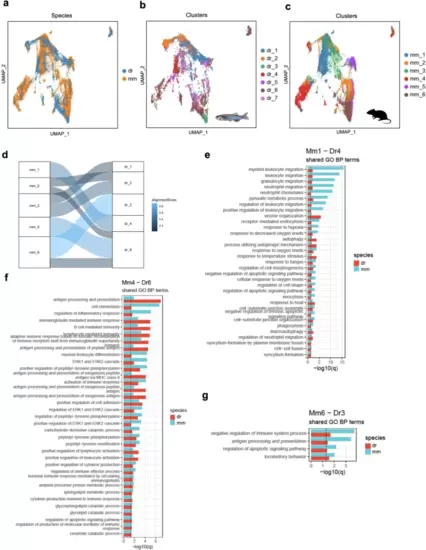
Interspecies similarities and differences in mono/M? subsets.UMAPs of mono/M? from the mouse (37,215 cells) and zebrafish (10,709 cells) plotted as total (a), zebrafish (b) and murine (c) clusters. d SAMap alignment of the mouse (mm) and zebrafish (dr) mono/M? subclusters. Edges with alignment scores less than 0.2 were omitted. The connections between the subclusters are colored by alignment score. Shared enriched biological process terms (GO-BP) between mm1-dr4 (e), mm4-dr6 (f), and mm6-dr3 (g) clusters based on subcluster markers for each species (mean AUC > 0.6). Only terms with an adjusted p < 0.05 in both species were included. |
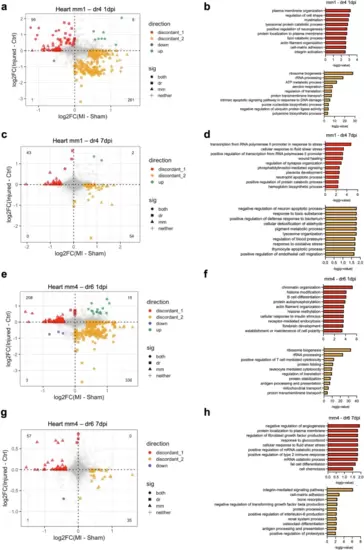
Differential transcriptional response to cardiac injury in mono/M? subsets between species.a Scatterplot of the fold changes in murine and zebrafish genes with cardiac injury compared to control in mm1 and dr4 cells at 1 dpi (FDR < 0.10 and |log2FC| > 0.25). b Enriched biological process terms of the differentially expressed genes (DEGs) that are discordant between mm1 and dr4 cells in (a). c Scatterplot of the fold changes in murine and zebrafish genes with cardiac injury compared to control in mm1 and dr4 cells at 7 dpi (FDR < 0.10 and |log2FC| > 0.25). d Enriched biological process terms of the DEGs that are discordant between mm1 and dr4 cells in (c). e Scatterplot of the fold changes in murine and zebrafish genes with cardiac injury compared to control in mm4 and dr6 cells at 1 dpi (FDR < 0.10 and |log2FC| >0.25). f Enriched biological process terms of the DEGs that are discordant between mm1 and dr4 cells in (e). g Scatterplot of the fold changes in murine and zebrafish genes with cardiac injury compared to control in mm4 and dr6 cells at 7 dpi (FDR < 0.10 and |log2FC| >0.25). h Enriched biological process terms of the DEGs discordant between mm1 and dr4 cells in g. In (a), (c), (e), and (g), concordant genes with FDR < 0.10 and |log2FC| > 0.25 in both species were colored blue when downregulated and green when upregulated. Discordant genes with FDR < 0.10 and |log2FC| > 0.25 in one specie were colored red when upregulated in zebrafish and yellow when upregulated in mouse. In (b), (d), (f), and (h), pathways with a -log10(p-value) >1.3 were considered significantly enriched. |
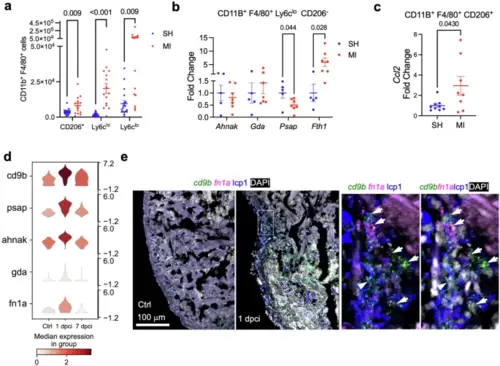
Cardiac macrophage response to heart injury by mono/M? clusters in mouse and zebrafish.a Enumeration of LV macrophages expressing CD206 and Ly6c as determined by flow cytometry in mice undergoing MI or sham at 1 dpi. n = 14SH/11MI (males), 4SH/4MI (females). b Gene expression analyses of Ly6cloCD206? FAC-sorted cardiac macrophages from sham or MI at 1 dpi. n = 3SH/6MI (males), 2SH/1MI (females). c Gene expression analysis of CD206+ FAC-sorted murine cardiac macrophages from sham or MI at 1 dpi. n = 5SH/6MI (males), 4SH/2MI (females). a?c Mean � S.E.M. Two-tailed Student?s t-test. d Violin plots of indicated genes in zebrafish cluster dr4 across timepoints. e Images of zebrafish heart cryosection showing HCR staining signals of cd9b and fn1a at 1 dpci in green and magenta, respectively. No expression was detected in the uninjured sample (Ctrl, left panel). Anti-lcp1 staining is shown in blue. DAPI staining is shown in white. The framed region is enlarged to show details on the right with different channel combinations. Arrowheads indicate representative cd9b+fn1a+lcp1+ cells. Scale bar, 100 ?m. |
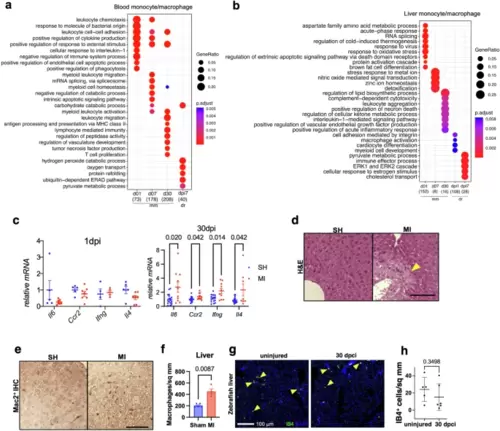
Chronic systemic and peripheral inflammation in response to heart injury in mouse but not zebrafish.Enriched biological process terms for mouse blood monocytes and zebrafish WKM (whole kidney marrow) monocytes (a) and liver macrophages (b) (mean AUC > 0.6, numbers in parenthesis below each column indicate number of upregulated genes). The gene ratio is indicated by the dot size and the significance by the color of the dot (P < 0.05). mm, mouse; dr, zebrafish. c qPCR expression of liver samples from mice with MI or sham (SH) at 1 and 30 dpi. 1 dpi: n = 5SH/7MI, 30 dpi: n = 18SH/10MI. Dots represent individual mice. Mean � S.E.M. Two-way ANOVA. d Representative liver sections stained by H&E (n = 3/group). Scale bar is 50 �m. Arrowhead indicates liver damage. e Mac2 immunohistochemistry in the liver (n = 5SH/4MI). Representative pictures are shown. Scale bar is 50 �m. f Quantification of Mac2+ liver macrophages in (e). n = 5SH/4MI male mice. Dots represent individual mice. Mean � S.E.M. Two-tailed Student?s t-test. g Section images of zebrafish liver showing staining against IB4 (green). DAPI staining is shown in blue. Livers were collected at 30 dpci of heart injury together with the uninjured fish. Arrowheads indicate IB4+ cells. Scale bar, 100 ?m. h Quantification of IB4+ macrophages in (g). n = 6 for each group. Mean � S.D. Two-tailed Student?s t-test. |
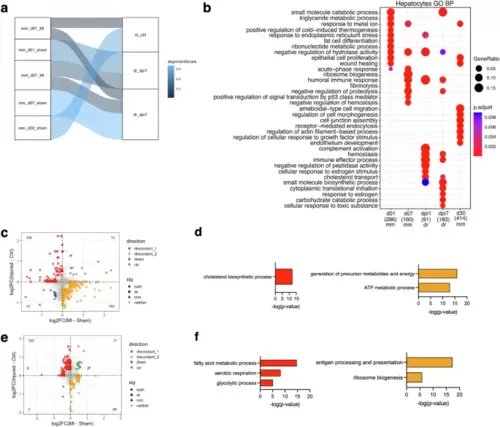
Hepatic outcomes after cardiac injury in mice and zebrafish.a SAMap alignment of the mouse (mm) and zebrafish (dr) hepatocyte scRNA-seq samples. Edges with alignment scores less than 0.2 were omitted. The connections between the samples are colored by alignment score. b Enriched biological process terms for mouse and zebrafish hepatocytes (mean AUC > 0.6). The gene ratio is indicated by the dot size and the significance by the color of the dot (p < 0.05). c Scatterplot of the fold changes in murine and zebrafish genes with cardiac injury compared to control in hepatocytes at 1 dpi (FDR < 0.10 and |log2FC| > 0.25). d Enriched biological process terms of the DEGs that are discordant between mouse and zebrafish hepatocytes in (c). e Scatterplot of the fold changes in murine and zebrafish genes with cardiac injury compared to control in hepatocytes at 7 dpi (FDR < 0.10 and |log2FC| > 0.25). f Enriched biological process terms of the DEGs that are discordant between mouse and zebrafish hepatocytes in (e). In (c) and (e), concordant genes (FDR < 0.10 and |log2FC| > 0.25) in both species were colored blue when downregulated and green when upregulated. Discordant genes (FDR < 0.10 and |log2FC| > 0.25) between species were colored red when upregulated in zebrafish and yellow when upregulated in mouse. In (d) and (f), GO terms with a -log10(p-value) >1.3 were considered significantly enriched. mm=mouse; dr=zebrafish. |