
|
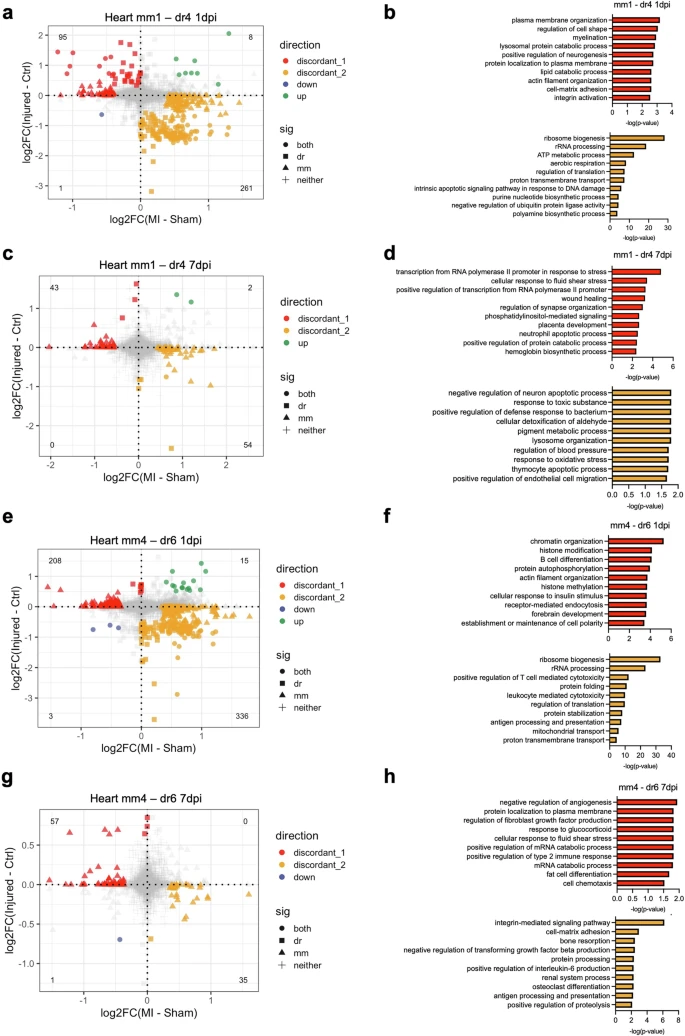
Fig. 5 Differential transcriptional response to cardiac injury in mono/M? subsets between species.a Scatterplot of the fold changes in murine and zebrafish genes with cardiac injury compared to control in mm1 and dr4 cells at 1 dpi (FDR < 0.10 and |log2FC| > 0.25). b Enriched biological process terms of the differentially expressed genes (DEGs) that are discordant between mm1 and dr4 cells in (a). c Scatterplot of the fold changes in murine and zebrafish genes with cardiac injury compared to control in mm1 and dr4 cells at 7 dpi (FDR < 0.10 and |log2FC| > 0.25). d Enriched biological process terms of the DEGs that are discordant between mm1 and dr4 cells in (c). e Scatterplot of the fold changes in murine and zebrafish genes with cardiac injury compared to control in mm4 and dr6 cells at 1 dpi (FDR < 0.10 and |log2FC| >0.25). f Enriched biological process terms of the DEGs that are discordant between mm1 and dr4 cells in (e). g Scatterplot of the fold changes in murine and zebrafish genes with cardiac injury compared to control in mm4 and dr6 cells at 7 dpi (FDR < 0.10 and |log2FC| >0.25). h Enriched biological process terms of the DEGs discordant between mm1 and dr4 cells in g. In (a), (c), (e), and (g), concordant genes with FDR < 0.10 and |log2FC| > 0.25 in both species were colored blue when downregulated and green when upregulated. Discordant genes with FDR < 0.10 and |log2FC| > 0.25 in one specie were colored red when upregulated in zebrafish and yellow when upregulated in mouse. In (b), (d), (f), and (h), pathways with a -log10(p-value) >1.3 were considered significantly enriched.