
|
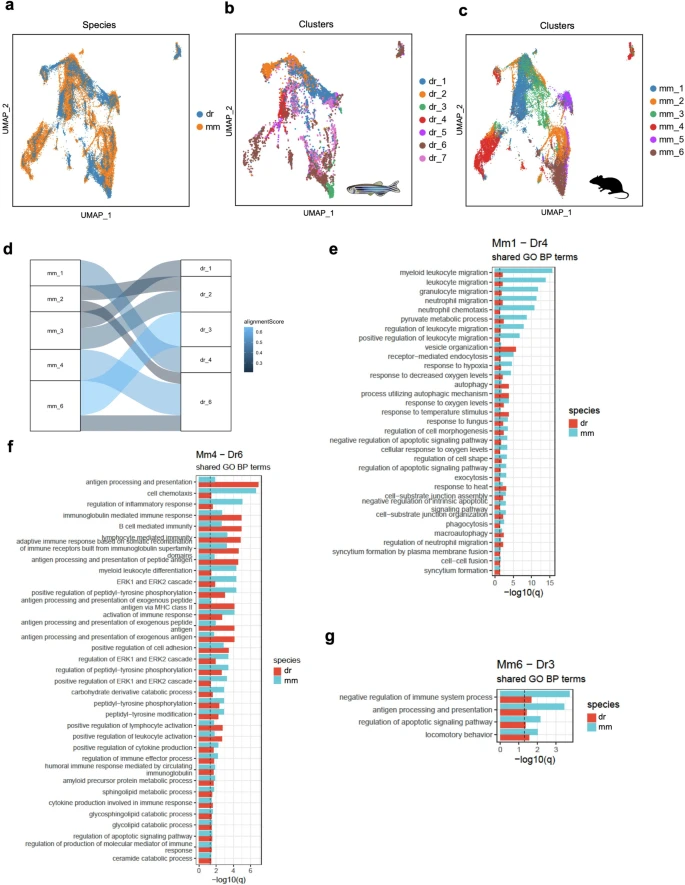
Fig. 4 Interspecies similarities and differences in mono/M? subsets.UMAPs of mono/M? from the mouse (37,215 cells) and zebrafish (10,709 cells) plotted as total (a), zebrafish (b) and murine (c) clusters. d SAMap alignment of the mouse (mm) and zebrafish (dr) mono/M? subclusters. Edges with alignment scores less than 0.2 were omitted. The connections between the subclusters are colored by alignment score. Shared enriched biological process terms (GO-BP) between mm1-dr4 (e), mm4-dr6 (f), and mm6-dr3 (g) clusters based on subcluster markers for each species (mean AUC > 0.6). Only terms with an adjusted p < 0.05 in both species were included.