
Fig. 3
- ID
- ZDB-FIG-250106-3
- Publication
- Cortada et al., 2024 - Cross-species single-cell RNA-seq analysis reveals disparate and conserved cardiac and extracardiac inflammatory responses upon heart injury
- Other Figures
- All Figure Page
- Back to All Figure Page
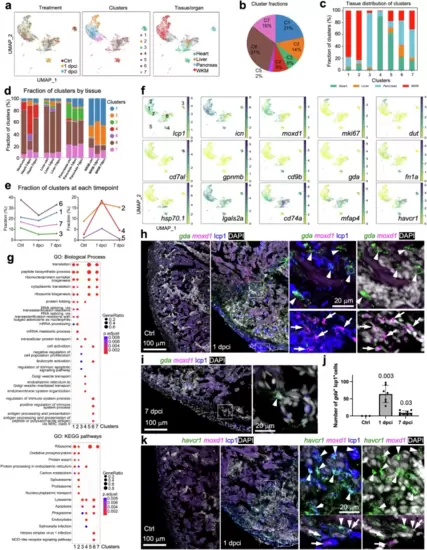
Mono/M? response to cryoinjury in zebrafish.a UMAPs of 10,709 reclustered mono/M?, colored by treatment group (Ctrl, 1 dpci, or 7 dpci; left), cluster (center) and tissue of origin (right). WKM, whole kidney marrow; Ctrl, uninjured; dpci, days post heart cryoinjury. b Fractions of each subcluster over total macrophages and monocytes. Tissue distribution of each mono/M? subcluster grouped by cluster (c) or tissue and treatment group (d). e Dynamics of subcluster fractions over total mono/M? in each treatment group (Ctrl, 1 dpci, or 7 dpci) across three groups. f UMAPs showing expression patterns of selected marker genes. g Enriched biological process terms (top) and KEGG pathway (bottom) for the subcluster markers (mean AUC > 0.6). The gene ratio is indicated by the dot size and the significance by the color of the dot (P < 0.05). h, i, Images of heart cryosection showing HCR staining signals of gda in green and moxd1 in magenta in Ctrl (uninjured), 1 dpci, and 7 dpci samples. Anti-lcp1 staining is shown in blue. DAPI staining is shown in white. The framed regions are enlarged to show details on the right with different channel combinations. Arrowheads and arrows indicate representative gda+lcp1+ and moxd1+lcp1+ cells, respectively. Scale bar, 100 ?m. j Quantification of gda+lcp1+ cells in the wound in Ctrl (uninjured), 1 dpci, and 7 dpci samples. n = 3 (Ctrl), 7 (1 dpci), and 8 (7 dpci). Mean � S.D. Student?s t-test versus the control. k Images of heart cryosection showing HCR staining signals of havcr1 and moxd1 at 1 dpci in green and magenta, respectively. Anti-lcp1 staining is shown in blue. DAPI staining is shown in white. The framed regions are enlarged to show details on the right with different channel combinations. Arrowheads and arrows indicate representative havcr1+lcp1+ and moxd1+lcp1+ cells, respectively. Scale bar, 100 ?m. |