
|
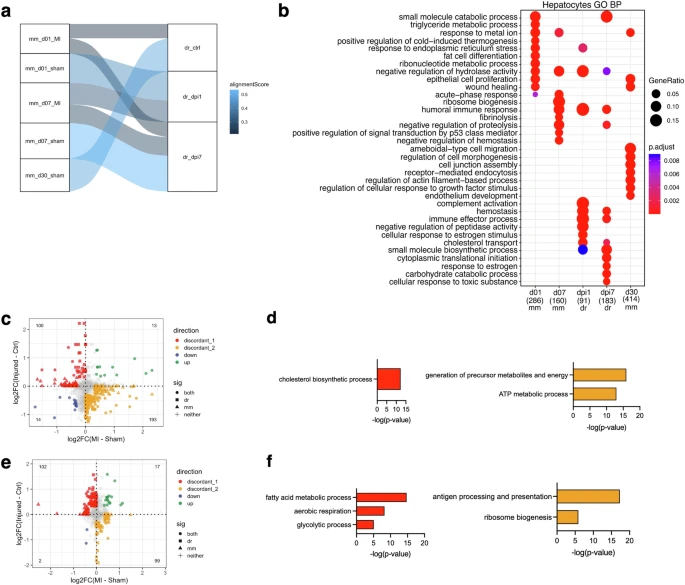
Fig. 8 Hepatic outcomes after cardiac injury in mice and zebrafish.a SAMap alignment of the mouse (mm) and zebrafish (dr) hepatocyte scRNA-seq samples. Edges with alignment scores less than 0.2 were omitted. The connections between the samples are colored by alignment score. b Enriched biological process terms for mouse and zebrafish hepatocytes (mean AUC > 0.6). The gene ratio is indicated by the dot size and the significance by the color of the dot (p < 0.05). c Scatterplot of the fold changes in murine and zebrafish genes with cardiac injury compared to control in hepatocytes at 1 dpi (FDR < 0.10 and |log2FC| > 0.25). d Enriched biological process terms of the DEGs that are discordant between mouse and zebrafish hepatocytes in (c). e Scatterplot of the fold changes in murine and zebrafish genes with cardiac injury compared to control in hepatocytes at 7 dpi (FDR < 0.10 and |log2FC| > 0.25). f Enriched biological process terms of the DEGs that are discordant between mouse and zebrafish hepatocytes in (e). In (c) and (e), concordant genes (FDR < 0.10 and |log2FC| > 0.25) in both species were colored blue when downregulated and green when upregulated. Discordant genes (FDR < 0.10 and |log2FC| > 0.25) between species were colored red when upregulated in zebrafish and yellow when upregulated in mouse. In (d) and (f), GO terms with a -log10(p-value) >1.3 were considered significantly enriched. mm=mouse; dr=zebrafish.