
Fig. 7
- ID
- ZDB-FIG-250106-7
- Publication
- Cortada et al., 2024 - Cross-species single-cell RNA-seq analysis reveals disparate and conserved cardiac and extracardiac inflammatory responses upon heart injury
- Other Figures
- All Figure Page
- Back to All Figure Page
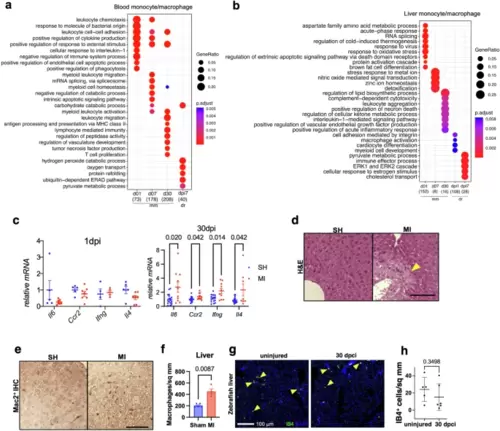
Chronic systemic and peripheral inflammation in response to heart injury in mouse but not zebrafish.Enriched biological process terms for mouse blood monocytes and zebrafish WKM (whole kidney marrow) monocytes (a) and liver macrophages (b) (mean AUC > 0.6, numbers in parenthesis below each column indicate number of upregulated genes). The gene ratio is indicated by the dot size and the significance by the color of the dot (P < 0.05). mm, mouse; dr, zebrafish. c qPCR expression of liver samples from mice with MI or sham (SH) at 1 and 30 dpi. 1 dpi: n = 5SH/7MI, 30 dpi: n = 18SH/10MI. Dots represent individual mice. Mean � S.E.M. Two-way ANOVA. d Representative liver sections stained by H&E (n = 3/group). Scale bar is 50 �m. Arrowhead indicates liver damage. e Mac2 immunohistochemistry in the liver (n = 5SH/4MI). Representative pictures are shown. Scale bar is 50 �m. f Quantification of Mac2+ liver macrophages in (e). n = 5SH/4MI male mice. Dots represent individual mice. Mean � S.E.M. Two-tailed Student?s t-test. g Section images of zebrafish liver showing staining against IB4 (green). DAPI staining is shown in blue. Livers were collected at 30 dpci of heart injury together with the uninjured fish. Arrowheads indicate IB4+ cells. Scale bar, 100 ?m. h Quantification of IB4+ macrophages in (g). n = 6 for each group. Mean � S.D. Two-tailed Student?s t-test. |