
Fig. 2
- ID
- ZDB-FIG-250106-2
- Publication
- Cortada et al., 2024 - Cross-species single-cell RNA-seq analysis reveals disparate and conserved cardiac and extracardiac inflammatory responses upon heart injury
- Other Figures
- All Figure Page
- Back to All Figure Page
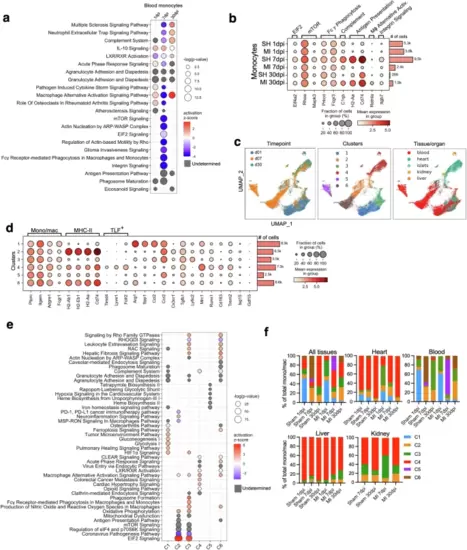
Dynamic cardiac and extracardiac mono/M? subcluster response to myocardial injury in mice.a Dot plot depicting enriched pathways in monocytes at 1, 7, and 30 days post infarction (dpi). b Dot plot shows gene expression in blood monocytes by experimental group (MI or SH) and timepoint. c UMAPs of all 37,215 sequenced mono/M? reclustered, colored by timepoint (left), cluster (center) and tissue of origin (right). d Dot plot shows normalized gene expression (dot color intensity) across all analyzed mono/M? clusters, regardless of tissue, timepoint and sham or MI procedure. Common mono/M? marker genes and MHC-II and TLF (Timd4, Lyve1 and Folr2) genes are indicated. e Dot plot depicting enriched pathways in mono/M? cell subclusters, regardless of tissue of origin, timepoint or sham/MI. f Stacked column plot shows percentage of the 6 murine subclusters (C1-C6) of total mono/M? by condition, timepoint and tissue. In (a) and (e) Dot size represents statistical significance of enrichment, dot color represents z-score. Positive z-score predicts activation of the pathway in the MI compared to the sham group and negative z-score predicts inhibition of the pathway in the MI compared to the sham group. Gray dots denote undetermined activation status. In (b) and (d): Color intensity in dot plots represents normalized mean expression, dot size represents fraction of cells expressing the gene. |