
|
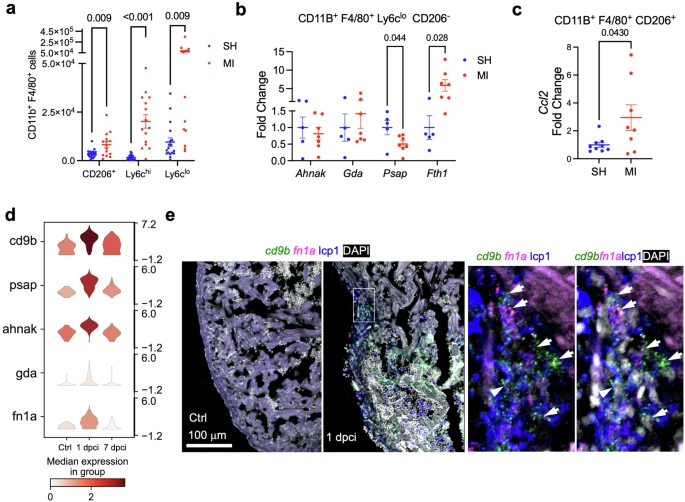
Fig. 6 Cardiac macrophage response to heart injury by mono/M? clusters in mouse and zebrafish.a Enumeration of LV macrophages expressing CD206 and Ly6c as determined by flow cytometry in mice undergoing MI or sham at 1 dpi. n = 14SH/11MI (males), 4SH/4MI (females). b Gene expression analyses of Ly6cloCD206? FAC-sorted cardiac macrophages from sham or MI at 1 dpi. n = 3SH/6MI (males), 2SH/1MI (females). c Gene expression analysis of CD206+ FAC-sorted murine cardiac macrophages from sham or MI at 1 dpi. n = 5SH/6MI (males), 4SH/2MI (females). a?c Mean � S.E.M. Two-tailed Student?s t-test. d Violin plots of indicated genes in zebrafish cluster dr4 across timepoints. e Images of zebrafish heart cryosection showing HCR staining signals of cd9b and fn1a at 1 dpci in green and magenta, respectively. No expression was detected in the uninjured sample (Ctrl, left panel). Anti-lcp1 staining is shown in blue. DAPI staining is shown in white. The framed region is enlarged to show details on the right with different channel combinations. Arrowheads indicate representative cd9b+fn1a+lcp1+ cells. Scale bar, 100 ?m.