
- Title
-
ABCA7-dependent induction of neuropeptide Y is required for synaptic resilience in Alzheimer's disease through BDNF/NGFR signaling
- Authors
- Tayran, H., Yilmaz, E., Bhattarai, P., Min, Y., Wang, X., Ma, Y., Wang, N., Jeong, I., Nelson, N., Kassara, N., Cosacak, M.I., Dogru, R.M., Reyes-Dumeyer, D., Stenersen, J.M., Reddy, J.S., Qiao, M., Flaherty, D., Gunasekaran, T.I., Yang, Z., Jurisch-Yaksi, N., Teich, A.F., Kanekiyo, T., Tosto, G., Vardarajan, B.N., ??, �., Ertekin-Taner, N., Mayeux, R., Kizil, C.
- Source
- Full text @ Cell Genom
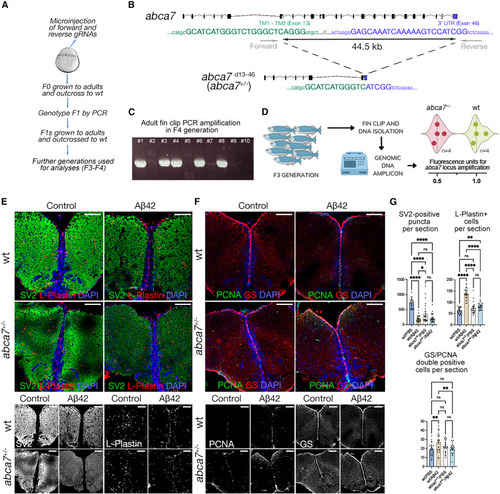
abca7 is required for synaptic integrity, microglial prevalence, and astroglial proliferation in zebrafish (A) Schematic view of generating abca7 knockout line. (B) 44.5-kb deletion in abca7 gene. (C) Representative genotyping PCR gel from F4 generation where positive bands indicate the deletion. Every column is one adult fin-clip DNA sample amplified with the forward and reverse primers in (B). (D) Genotyping results with genomic DNA qPCR in F3 adults. Eight animals (four wild-type and four heterozygous deletions) were used. Heterozygous deletions show reduced amplification (lower fluorescence). Results depicted as violin plots and individual values. (E) Immunofluorescence (IF) for SV2 (green) and L-plastin (red) with DAPI counterstain in wild type and abca7+/? with and without A?42. Black and white panels indicate individual fluorescent channels. (F) IF for PCNA (green) and GS (red) with DAPI counterstain in wild type and abca7+/? with and without A?42. Black and white panels indicate individual fluorescent channels. (G) Quantification of SV2-positive synaptic puncta, number of microglial cells, and number of proliferating astroglia. One-way ANOVA with Tukey?s multiple comparison test was used for statistical analyses. n = 4 animals from both sexes with 24 brain sections per group. ?p < 0.0332, ??p < 0.0021, ???p < 0.0002, ????p < 0.0001; not significant (ns), p > 0.0332. Scale bars, 100 ?m. See also Figures S1 and S4 , Data S1 , and Table S1 . |
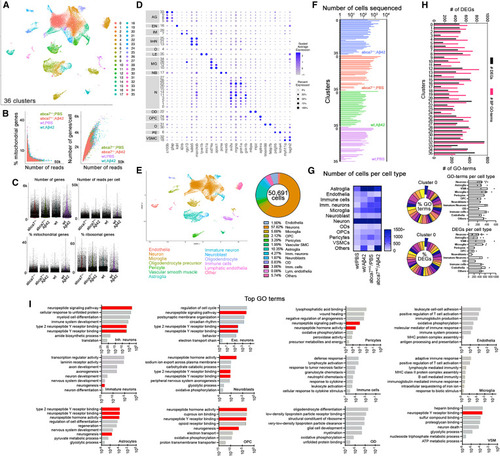
Single-cell transcriptomics in abca7 knockout zebrafish (A) Combined UMAP plot for single-cell transcriptomics from wild-type + PBS, wild-type + A?42, abca7+/? + PBS, and abca7+/? + A?42 samples; 36 cell clusters were identified. (B) Percentage of mitochondrial counts and number of genes per cell. (C) Number of genes, number of reads per cell, percentage of mitochondrial gene expression, and percentage of ribosomal genes in every sample. (D) Dotplot for cell-type markers identify distinct cell types. (E) UMAP plot classifying cell types and their percent prevalence in a total of 50,691 cells sequenced. (F) Distribution of the number of cells sequenced in all 36 clusters in every sample. (G) Heatmap showing the number of sequenced cells per cell type. (H) Number of differentially expressed genes (DEGs, black) and gene ontology (GO) terms related to biological processes (magenta) between wild-type + A?42 and abca7+/? + A?42 samples. Lower panels indicate pie chart of the percentage of GO terms and DEGs per cluster between wild-type + A?42 and abca7+/? + A?42 samples, and the numbers of GO terms and DEGs per cell type as bar graphs. (I) Tally for top GO terms in distinct cell types. Neuropeptide signaling pathway and neurogenesis are enriched in neurons, neuroblasts, astroglia, oligodendrocyte progenitors, and vascular smooth muscle cells. See also Figures S2?S4 , Data S2 and S3 , and Table S1 . |
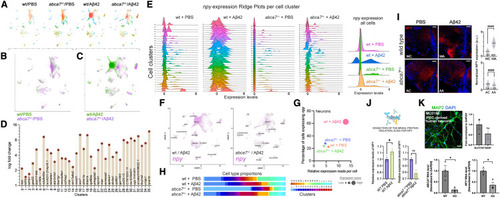
npy expression is reduced with abca7 knockout (A) UMAP clustering for individual experimental groups of wild-type/PBS, wild-type/A?42, abca7+/?/PBS, and abca7+/?/A?42. (B) Combined UMAP for wild type (green) and abca7 knockout (violet) shows overlapping cell clusters. (C) Combined UMAP for wild-type + A?42 (green) and abca7+/? + A?42 (violet) identifies a specific neuronal cluster (Cluster 0) that is enriched in A?42-treated wild-type animals, but this cluster is significantly diminished in abca7 knockout. (D) Top marker genes for every cell cluster identify neuropeptide Y (npy) as the top marker for cluster 0. Log fold change is a measure of the difference of expression of the top markers in their clusters. (E) Ridge plots for npy expression in wild-type + PBS, wild-type + A?42, abca7+/? + PBS, and abca7+/? + A?42 groups in all cell clusters. The rightmost plot is combination of all cells. (F) Individual expression plots for npy in wild type (left) and abca7 knockout (right) after A?42. Cluster 0, expressing npy, is strongly reduced. (G) A Distribution graph for expression score of npy in neurons. Expression score is a combinatorial measure for the percentage of cells expressing npy (y axis) and the average relative read number per cell (x axis). Amyloid induces the expression score in wild-type animals but not in abca7 knockout. (H) Proportions of all cell clusters in wild-type and abca7+/? animals with and without A?42. (I) Immunofluorescence for Npy with DAPI counterstain in wild-type and abca7 knockout animals with or without amyloid toxicity (WC, wild-type + PBS control; WA, wild-type + A?42; AC, abca7+/? + PBS control; AA, abca7+/? + A?42). Quantification of image fluorescence intensities shown in the graph. One-way ANOVA with Brown-Forsythe and Welch post test with two-stage linear step-up procedure of Benjamini, Krieger, and Yekutieli correction was used for statistical analyses. (J) ELISA assay for Npy. A?42 induces Npy protein in wild-type animals but not in abca7 knockout. Parametric t test was used for statistical analyses. (K) MAP2 immunostaining and RT-qPCR for excitatory (SLC17A7) and inhibitory (GAD1) neuron markers. Lower graphs show RT-qPCR results for the expression of ABCA7 and NPY in control and ABCA7 knockout neurons. Data points are technical replicates. ?p < 0.05, ????p < 0.0001; not significant (ns), p > 0.05. Scale bars, 50 ?m. See also Figures S2?S4 ; Data S1 , S2 , and S3 ; Table S1 . |
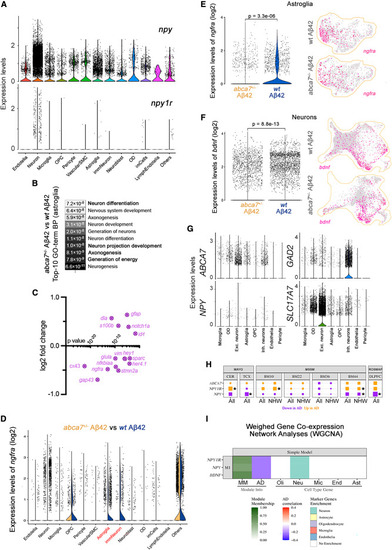
NPY is reduced in Alzheimer?s brains and interacts with BDNF-NGFR signaling (A) Violin plot for npy and npy1r expression in every identified cell type in zebrafish. (B) Top ten enriched GO terms when abca7+/? + A?42 and wild-type + A?42 were compared indicate altered neurogenesis mechanisms in astroglia. (C) Neurogenic genes are downregulated and quiescence genes are upregulated in astroglia after abca7 knockout. (D) Violin plot for expression of ngfra in astroglia when abca7+/? + A?42 is compared to wild-type + A?42. (E) Expression of ngfra is strongly reduced in astroglia. (F) Ngfra ligand Bdnf is significantly reduced in neurons. (G) Expression of ABCA7 and NPY in human brains (data reanalyzed from Lau et al. 60 ), showing co-expression in neurons. (H) Expression analyses in various AMP-AD brain transcriptome datasets indicate uniform downregulation of NPY with AD. Asterisks indicate statistical significance (p < 0.05). (I) Weighed gene co-expression network analyses based on Mayo Clinic temporal cortex (TCX) RNA-seq data indicate NPY, NPY1R, and BDNF expressions are negatively correlating with AD and are associated with neurons. See also Figure S4 ; Data S1 , S2 , S3 , S4 , and S5 ; Tables S1?S3 . |
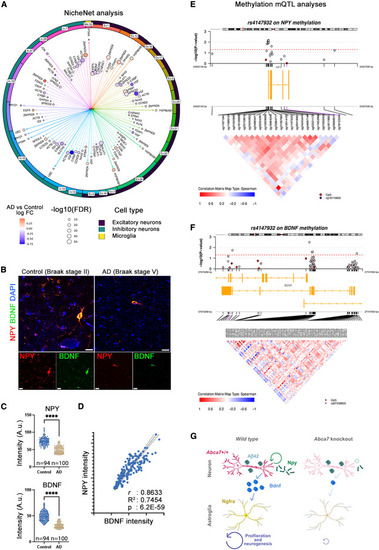
NPY interacts with BDNF-NGFR signaling (A) NPY-centered NicheNet analysis in human brain datasets of single-nucleus RNA-seq. Excitatory neurons cluster 1 showed reduced BDNF in AD in an NPY-dependent manner. Arrows represent the cumulative measure for log fold change. (B) Double immunohistochemistry for NPY and BDNF in postmortem control and AD brains. Scale bars, 10 ?m. (C) Quantification results of NPY and BDNF intensities in neurons. Two postmortem brains used per group. n denotes the number of neurons analyzed. Asterisks denote p < 1.0E?15 (non-parametric Kolmogorov-Smirnov test). (D) Correlation analyses between BDNF and NPY in 194 neurons analyzed (simple linear regression). (E and F) CpG methylation mQTL analyses with ABCA7 variants in humans. The epigenetic changes on NPY (E) and BDNF (F) are shown. Red line indicates statistical significance cutoff. Every circle represents one methylation site. Blue indicates hypermethylation, and red indicates hypomethylation. Yellow bars indicate the gene location and coding direction. Enlarged region lists all methylation sites in the corresponding genomics window. Correlation matrices between different methylation sites are depicted as positive (red) and negative (blue). ABCA7 variants exert methylation changes in NPY and BDNF promoters in a highly correlated manner. (G) Working model for Abca7-dependent Npy activity. ????p < 0.0001. See also Figure S4 ; Data S1 , S2 , S3 , S4 , and S5 ; Tables S1?S3 . |

ABCA7 regulates synaptic integrity and astroglial proliferation through BDNF (A) Experimental setup for investigating the biological relevance of NPY to abca7 function and amyloid-induced alterations in synaptic integrity, microglial activity, and astroglial proliferation. (B) Immunofluorescence for SV2 + L-plastin and GS + PCNA with DAPI counterstains in abca7+/? + PBS, abca7+/? + A?42, abca7+/? + NPY, and abca7+/? + A?42 + NPY brains. (C) Quantification for number of SV2-positive synaptic puncta, L-plastin-positive microglia, and GS/PCNA double-positive proliferating astroglia. n = 4 animals from both sexes and ?20 brain sections per group. One-way ANOVA with Tukey?s multiple comparison test was used for statistical analyses. No comparison bar indicates no significance. (D) BDNF immunoreactivity in wild-type and abca7 knockout zebrafish with and without A?42. A?42 induced BDNF (red) in wild-type animals but not in abca7 knockout. Injection of NPY with or without A?42 restores the induced BDNF expression levels. Non-parametric Kolmogorov-Smirnov test comparing cumulative distributions and one-way ANOVA with Tukey?s multiple comparison test were used for statistical analyses. (E) Immunofluorescence for SV2 and L-plastin with DAPI counterstain in abca7+/? + A?42 + PBS and abca7+/? + A?42 + BDNF zebrafish brains. Quantification for the number of SV2-positive synaptic puncta and the number of L-plastin-positive microglia. Non-parametric Kolmogorov-Smirnov test comparing cumulative distributions was used for statistical analyses. BDNF rescues synaptic integrity changes in abca7+/? knockout similar to NPY. n = 4 animals from both sexes, with 18 brain sections per group. ?p < 0.0332, ??p < 0.0021, ???p < 0.0002, ????p < 0.0001; not significant (ns), p > 0.0332. Scale bars, 50 ?m. See also Figures S1 and S4 , Data S1 and S3 , and Table S1 . |
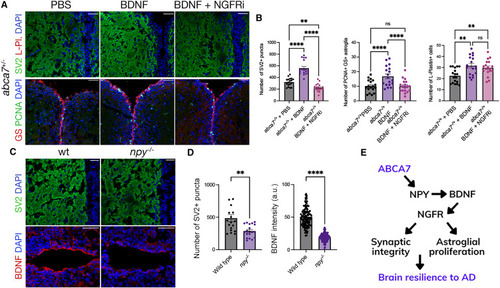
ABCA7-dependent NPY acts through BDNF/NGFR axis (A) Immunofluorescence for SV2/L-plastin and GS/PCNA with DAPI counterstain in abca7+/? knockout brains injected with vehicle (PBS), BDNF, and BDNF + NGFR inhibitor. (B) Quantification graphs for SV2+ puncta, number of PCNA/GS double-positive astroglia, and number of L-plastin+ microglia. Inhibition of NGFR abrogates the rescue effects of BDNF on synaptic integrity and astroglial proliferation. Two-way ANOVA with Tukey?s multiple comparison test was used for statistical analyses. n = 4 animals from both sexes, with 18 brain sections per group. (C) Immunofluorescence in npy?/? knockout animals for SV2 and BDNF with DAPI nuclear counterstain. (D) Quantification of the number of SV2+ synaptic puncta and BDNF intensity. npy?/? knockout independently reduces BDNF expression and the synaptic integrity. n = 3 animals from both sexes and 18 brain sections per group. (E) Activity model for ABCA7: ABCA7-dependent induction of NPY after amyloid toxicity is required for expression of BDNF, which?through NGFR?regulates the synaptic integrity and astroglial proliferation. ABCA7 function is relevant to brain resilience to AD in an NPY-dependent manner. ?p < 0.0332, ??p < 0.0021, ???p < 0.0002, ????p < 0.0001; not significant (ns), p > 0.0332. Scale bars, 50 ?m. See also Figures S1 and S4 , Data S1 and S3 , and Table S1 . |