
|
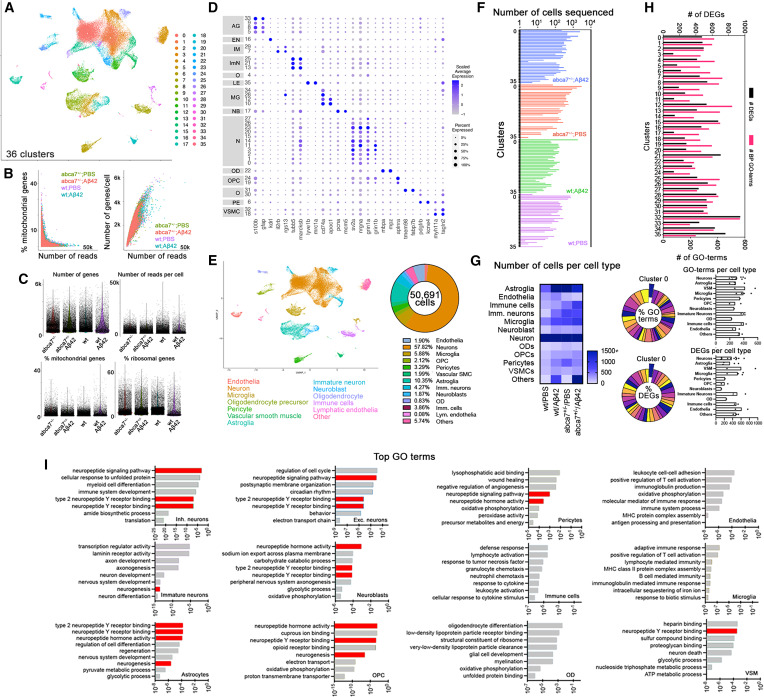
Fig. 2 Single-cell transcriptomics in abca7 knockout zebrafish (A) Combined UMAP plot for single-cell transcriptomics from wild-type + PBS, wild-type + A?42, abca7+/? + PBS, and abca7+/? + A?42 samples; 36 cell clusters were identified. (B) Percentage of mitochondrial counts and number of genes per cell. (C) Number of genes, number of reads per cell, percentage of mitochondrial gene expression, and percentage of ribosomal genes in every sample. (D) Dotplot for cell-type markers identify distinct cell types. (E) UMAP plot classifying cell types and their percent prevalence in a total of 50,691 cells sequenced. (F) Distribution of the number of cells sequenced in all 36 clusters in every sample. (G) Heatmap showing the number of sequenced cells per cell type. (H) Number of differentially expressed genes (DEGs, black) and gene ontology (GO) terms related to biological processes (magenta) between wild-type + A?42 and abca7+/? + A?42 samples. Lower panels indicate pie chart of the percentage of GO terms and DEGs per cluster between wild-type + A?42 and abca7+/? + A?42 samples, and the numbers of GO terms and DEGs per cell type as bar graphs. (I) Tally for top GO terms in distinct cell types. Neuropeptide signaling pathway and neurogenesis are enriched in neurons, neuroblasts, astroglia, oligodendrocyte progenitors, and vascular smooth muscle cells. See also Figures S2?S4 , Data S2 and S3 , and Table S1 .