
|
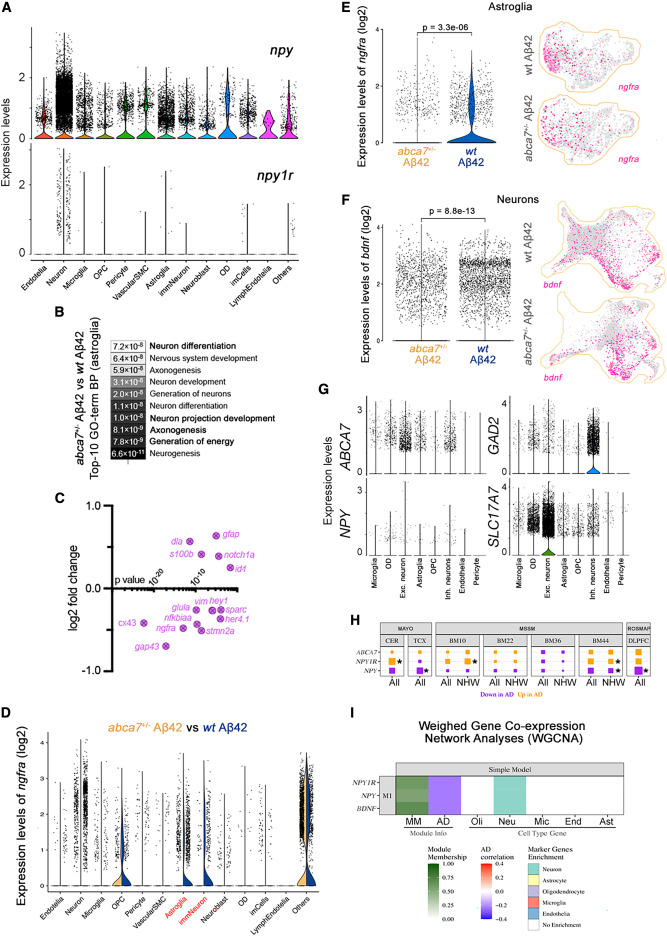
Fig. 4 NPY is reduced in Alzheimer?s brains and interacts with BDNF-NGFR signaling (A) Violin plot for npy and npy1r expression in every identified cell type in zebrafish. (B) Top ten enriched GO terms when abca7+/? + A?42 and wild-type + A?42 were compared indicate altered neurogenesis mechanisms in astroglia. (C) Neurogenic genes are downregulated and quiescence genes are upregulated in astroglia after abca7 knockout. (D) Violin plot for expression of ngfra in astroglia when abca7+/? + A?42 is compared to wild-type + A?42. (E) Expression of ngfra is strongly reduced in astroglia. (F) Ngfra ligand Bdnf is significantly reduced in neurons. (G) Expression of ABCA7 and NPY in human brains (data reanalyzed from Lau et al. 60 ), showing co-expression in neurons. (H) Expression analyses in various AMP-AD brain transcriptome datasets indicate uniform downregulation of NPY with AD. Asterisks indicate statistical significance (p < 0.05). (I) Weighed gene co-expression network analyses based on Mayo Clinic temporal cortex (TCX) RNA-seq data indicate NPY, NPY1R, and BDNF expressions are negatively correlating with AD and are associated with neurons. See also Figure S4 ; Data S1 , S2 , S3 , S4 , and S5 ; Tables S1?S3 .