
Fig. 3
- ID
- ZDB-FIG-240913-22
- Publication
- Tayran et al., 2024 - ABCA7-dependent induction of neuropeptide Y is required for synaptic resilience in Alzheimer's disease through BDNF/NGFR signaling
- Other Figures
- All Figure Page
- Back to All Figure Page
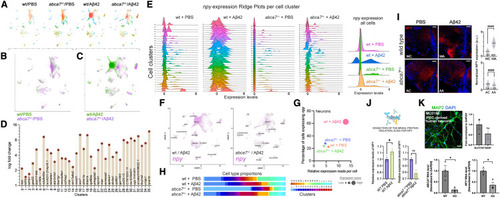
npy expression is reduced with abca7 knockout (A) UMAP clustering for individual experimental groups of wild-type/PBS, wild-type/A?42, abca7+/?/PBS, and abca7+/?/A?42. (B) Combined UMAP for wild type (green) and abca7 knockout (violet) shows overlapping cell clusters. (C) Combined UMAP for wild-type + A?42 (green) and abca7+/? + A?42 (violet) identifies a specific neuronal cluster (Cluster 0) that is enriched in A?42-treated wild-type animals, but this cluster is significantly diminished in abca7 knockout. (D) Top marker genes for every cell cluster identify neuropeptide Y (npy) as the top marker for cluster 0. Log fold change is a measure of the difference of expression of the top markers in their clusters. (E) Ridge plots for npy expression in wild-type + PBS, wild-type + A?42, abca7+/? + PBS, and abca7+/? + A?42 groups in all cell clusters. The rightmost plot is combination of all cells. (F) Individual expression plots for npy in wild type (left) and abca7 knockout (right) after A?42. Cluster 0, expressing npy, is strongly reduced. (G) A Distribution graph for expression score of npy in neurons. Expression score is a combinatorial measure for the percentage of cells expressing npy (y axis) and the average relative read number per cell (x axis). Amyloid induces the expression score in wild-type animals but not in abca7 knockout. (H) Proportions of all cell clusters in wild-type and abca7+/? animals with and without A?42. (I) Immunofluorescence for Npy with DAPI counterstain in wild-type and abca7 knockout animals with or without amyloid toxicity (WC, wild-type + PBS control; WA, wild-type + A?42; AC, abca7+/? + PBS control; AA, abca7+/? + A?42). Quantification of image fluorescence intensities shown in the graph. One-way ANOVA with Brown-Forsythe and Welch post test with two-stage linear step-up procedure of Benjamini, Krieger, and Yekutieli correction was used for statistical analyses. (J) ELISA assay for Npy. A?42 induces Npy protein in wild-type animals but not in abca7 knockout. Parametric t test was used for statistical analyses. (K) MAP2 immunostaining and RT-qPCR for excitatory (SLC17A7) and inhibitory (GAD1) neuron markers. Lower graphs show RT-qPCR results for the expression of ABCA7 and NPY in control and ABCA7 knockout neurons. Data points are technical replicates. ?p < 0.05, ????p < 0.0001; not significant (ns), p > 0.05. Scale bars, 50 ?m. See also Figures S2?S4 ; Data S1 , S2 , and S3 ; Table S1 . |