FIGURE SUMMARY
Title

Clinical and preclinical therapeutic outcome metrics for USH2A-related disease

Authors
Toms, M., Dubis, A.M., de Vrieze, E., Tracey-White, D., Mitsios, A., Hayes, M., Broekman, S., Baxendale, S., Utoomprurkporn, N., Bamiou, D., Bitner-Glindzicz, M., Webster, A.R., Van Wijk, E., Moosajee, M.
Source
Full text @ Hum. Mol. Genet.

ZFIN is incorporating published figure images and captions as part of an ongoing project. Figures from some publications have not yet been curated, or are not available for display because of copyright restrictions.

EXPRESSION / LABELING:
Gene:
Fish:
Anatomical Term:
Stage: Day 5
PHENOTYPE:
Fish:
Observed In:
Stage: Day 5

ZFIN is incorporating published figure images and captions as part of an ongoing project. Figures from some publications have not yet been curated, or are not available for display because of copyright restrictions.

Position and type of USH2A variants in participating patients. Schematic diagram of the usherin protein domain architecture and USH2A exon structure. The genetic position and type of mutation of the identified USH2A variants in the patients within this study are presented as lollypops at the corresponding location in the usherin protein. Black labels correspond to nonsense mutations, white labels correspond to missense variants, diagonal lines correspond to splice site variants and grey labels correspond to insertion and deletion frameshift changes. LamGL, laminin globular-like domain; LamNT, N-terminal laminin domain; LamEGF, laminin-type epidermal growth factor-like domains; FN3, fibronectin III domains; TM, transmembrane domain; PDZ, PDZ-binding domain.

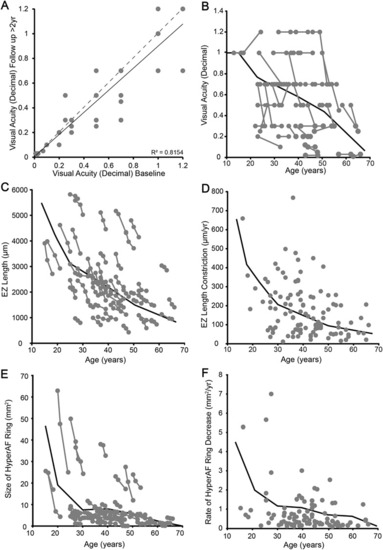
Visual acuity, EZ and hyperautofluorescent (hyperAF) ring measurements with age in USH2A patients. (A) and (B) Change in visual acuity over the observation period. (A) illustrates the change in BCVA between baseline and final follow up. The grey dashed line represents ‘no change’ while the black correlation line illustrates the subtle change. The measurement of each patient at each visit is depicted as a function of age in (B). (C) Correlation between EZ length and age. (D) EZ constriction rate (change in size divided by time between visits) as a function of age. Both (C) and (D) illustrate that the degeneration starts rapidly with later, slower decline. (E) and (F) illustrate the same changes in hyperAF ring area.

Inter-relatedness of progression between metrics. While there is a strong correlation between the rate of change observed in the first and second observation periods for both EZ length constriction (A) and hyperautofluorescence (hyperAF) ring constriction (B), neither correlation line describes the data well (r2 = 0.207 and 0.227 respectively). The ratio of EZ length and hyperAF ring constriction accounts for a much greater share of the variability (C, r2 = 0.4355).

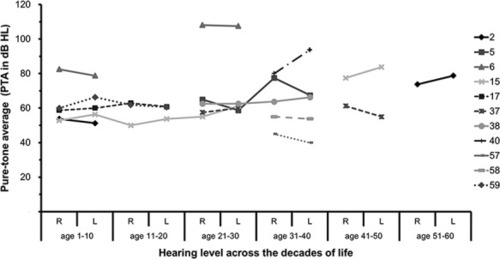
Degree and progression of hearing loss in USH2A patients. Pure tone average (PTA) measurements (decibel hearing loss, dB HL) from right (R) and left (L) ears of USH2A patients obtained within different decades of lifetime. Color key corresponds to patient number.

Generation of ush2au507zebrafish. (A) Schematic representation of zebrafish and human usherin domain architecture. The u507 mark on zebrafish usherin indicates the region targeted by CRISPR/Cas9. (B) Sanger sequencing traces showed the ush2a gene sequence change in homozygous ush2au507 mutant zebrafish (c.2131_2203 + 73delinsCGGCGG) at the CRISPR/Cas9 target site. (C) Anti-usherin-C (red) and anti-centrin (green) immunostaining of retinal sections from wt and ush2au507 larvae (5 dpf). DAPI nucleic acid stain was used as a counterstain (blue). PAM, protospacer adjacent motif. INL, inner nuclear layer; OPL, outer plexiform layer; ONL, outer nuclear layer; dpf, days post fertilization. Scale bar = 10 μm.

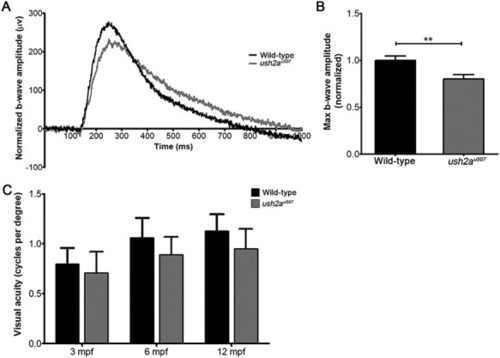
Visual function in ush2au507 zebrafish. (A) Normalized average b-wave amplitude of ERG responses recorded from wt and ush2au507 zebrafish at 5 days post fertilization (wt: n = 69, ush2au507: n = 67). (B) Maximum b-wave amplitudes are plotted as bar graphs (mean ± SEM). (C) Visual acuity (cycles per degree, cpd) of wt and ush2au507 zebrafish at 3 months post fertilization (mpf), 6 mpf and 12 mpf, assessed using the optokinetic response assay (n = 4–5, mean ± SEM). **P < 0.001. Mann Whitney tests and two-way ANOVA were used to test for statistical significance in ERG and optokinetic response data, respectively.

PHENOTYPE:
Fish:
Observed In:
Stage Range: Day 5 to Adult

Auditory function in ush2au507 larvae. (A) and (B) Macular hair cell cross-sections from 6 days post fertilization (dpf) wt and ush2au507 larvae were immunostained with anti-acetylated tubulin (red), anti-usherin-N (green) and DAPI (blue). (C) and (D) Stereociliary hair bundles of the anterior macula in wt and ush2au507 zebrafish at 6 days post fertilization stained with Alexa Fluor 647 Phalloidin. Bar graph (E) shows the number of hair cell bundles per anterior macula in wt and ush2au507 larvae (mean ± SEM, n = 10). Bar graph (F) shows distance moved in response to acoustic stimuli of different frequencies (mean ± SEM, n ≥ 77 from three biological replicates per group). An unpaired t-test or two-way ANOVA were used to test for statistical significance. *P < 0.05. Scale bars = 10 μm.

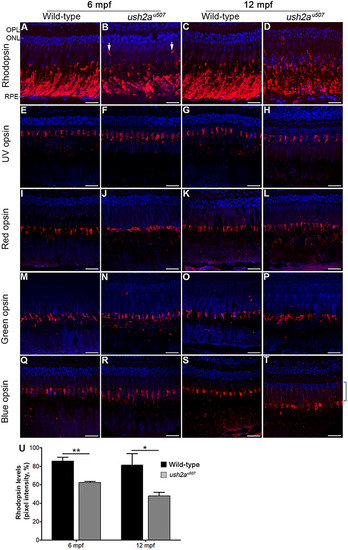
Rod and cone opsin localization in the ush2au507 retina. Rhodopsin (AD) and UV (EH), red (IL), green (MP) and blue (QT) cone opsins were detected in the wt and ush2au507 zebrafish retina at 6 months post fertilization (mpf), and 12 mpf by immunohistochemical analysis (red). In the 6 mpf ush2au507 retina, rhodopsin was partially mislocalized in some regions where it was detected in parts of the rod photoreceptors other than the outer segment (arrows in B). In the 12 mpf mutant retina, rhodopsin was more extensively mislocalized and expression in the rod outer segments was reduced compared to wt. Blue opsin was noted in the blue cone inner segments (highlighted with a bracket) in the ush2au507 retina at 12 mpf (T). All sections are counterstained with DAPI nuclei acid stain (blue). Bar chart (U) shows levels of rhodopsin detected in the rod outer segments at 6 and 12 mpf, measured using pixel intensity on confocal images (mean ± SEM. Three sections analyzed per fish, n = 3 per age). Unpaired t-tests were used to compare wt and ush2au507 rhodopsin levels at each age. *P < 0.05, **P < 0.01. OPL, outer plexiform layer; ONL, outer nuclear layer; RPE, retinal pigment epithelium. Scale bar = 25 μm.

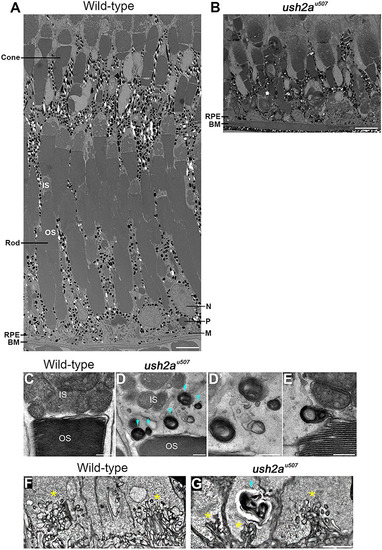
Retinal ultrastructure of ush2au507 zebrafish. Transmission electron microscopy was used to examine the wt and ush2au507 retinal ultrastructure at 6 months post fertilization (mpf). The wt retina showed tiers of morphologically distinct cone and rod photoreceptors with overlying retinal pigment epithelium (RPE) with long apical projections that interdigitated with the photoreceptors (A). Among mostly preserved tissue, regions of rod loss could be observed in the ush2au507 retina (B). Presumptive lysosomal structures (blue arrows) were noted at the inner and outer segment boundary (D, E) and at the synapses (G) of the ush2au507 photoreceptors at 6 mpf. Ribbon synapses are indicated by *. These vesicles were not observed in wt photoreceptors (C, F). IS, inner segment; OS, outer segment; IS, inner segment; OS, outer segment; RPE, retinal pigment epithelium; BM, Bruch’s membrane; N, nucleus; P, phagosome; M, melanosome. Scale bars = 5 μm (A, B, F, G) and 500 nm (C–E).

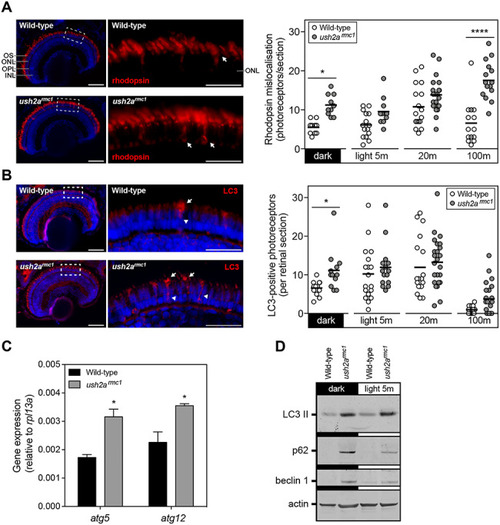
Rhodopsin mislocalization and elevated autophagy in ush2armc1 larvae. (A) Rhodopsin (red) was predominantly detected in the outer segment of wt and ush2armc1 larvae at 6 dpf. The inner segments occasionally revealed rhodopsin immunofluorescence, indicative of mislocalized rhodopsin transport vesicles (arrow). Representative images of dark-adapted larvae are shown for both genotypes. Quantification of the number of photoreceptors with distinct rhodopsin immunofluorescence in the inner segment revealed increased rhodopsin mislocalization in ush2armc1 mutants. Two-way ANOVA revealed a significant interaction between the moment of sampling and the genotype of the larvae (P = 0.0019), a significant difference in rhodopsin mislocalization between wt and ush2armc1 mutants (P < 0.0001) and difference in rhodopsin mislocalization depending on moment of sampling (P < 0.0001). Bonferroni’s post-test was used to reveal differences between groups (*P < 0.05; ****P < 0.0001). (B) LC3 immunoreactivity, a marker for autophagosome vesicles, could be observed in the periciliary region (arrow) and inner segment (arrowhead) of a subset of photoreceptors. Representative images of dark-adapted larvae, are shown for both genotypes. Quantification of the number of photoreceptors with distinct LC3 immunofluorescence in the inner segment revealed increased presence of autophagosomes in ush2armc1 mutants. Two-way ANOVA revealed no significant interaction between the moment of sampling and the genotype of the larvae, a significant difference in LC3-positive photoreceptors between wt and ush2armc1 mutants (P = 0.0078) and difference in LC3-positive photoreceptors depending on moment of sampling (P < 0.0001). Bonferroni’s post-test was used to reveal differences between groups (*P < 0.05). (C) Quantitative RT-PCR analysis of autophagy associated genes atg5 and atg12 in wt and ush2armc1 larvae. Two pools of 10 larvae were used per genotype (*P < 0.05, unpaired t-test). (D) Western blot analysis of pooled larvae, using antibodies directed at several markers of autophagy, revealed differences in expression of these markers between wt and ush2armc1 mutants. Anti-actin was used as a loading control. OS, outer segments; ONL, outer nuclear layer; OPL, outer plexiform layer; INL, inner nuclear layer. Scale bars = 25 μm.

Acknowledgments
This image is the copyrighted work of the attributed author or publisher, and ZFIN has permission only to display this image to its users. Additional permissions should be obtained from the applicable author or publisher of the image. Full text @ Hum. Mol. Genet.