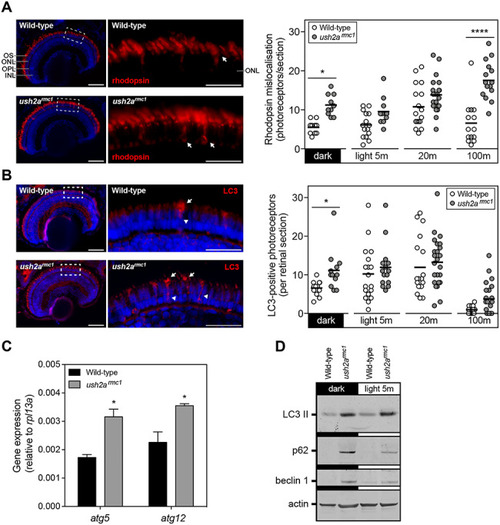
Rhodopsin mislocalization and elevated autophagy in ush2armc1 larvae. (A) Rhodopsin (red) was predominantly detected in the outer segment of wt and ush2armc1 larvae at 6 dpf. The inner segments occasionally revealed rhodopsin immunofluorescence, indicative of mislocalized rhodopsin transport vesicles (arrow). Representative images of dark-adapted larvae are shown for both genotypes. Quantification of the number of photoreceptors with distinct rhodopsin immunofluorescence in the inner segment revealed increased rhodopsin mislocalization in ush2armc1 mutants. Two-way ANOVA revealed a significant interaction between the moment of sampling and the genotype of the larvae (P = 0.0019), a significant difference in rhodopsin mislocalization between wt and ush2armc1 mutants (P < 0.0001) and difference in rhodopsin mislocalization depending on moment of sampling (P < 0.0001). Bonferroni’s post-test was used to reveal differences between groups (*P < 0.05; ****P < 0.0001). (B) LC3 immunoreactivity, a marker for autophagosome vesicles, could be observed in the periciliary region (arrow) and inner segment (arrowhead) of a subset of photoreceptors. Representative images of dark-adapted larvae, are shown for both genotypes. Quantification of the number of photoreceptors with distinct LC3 immunofluorescence in the inner segment revealed increased presence of autophagosomes in ush2armc1 mutants. Two-way ANOVA revealed no significant interaction between the moment of sampling and the genotype of the larvae, a significant difference in LC3-positive photoreceptors between wt and ush2armc1 mutants (P = 0.0078) and difference in LC3-positive photoreceptors depending on moment of sampling (P < 0.0001). Bonferroni’s post-test was used to reveal differences between groups (*P < 0.05). (C) Quantitative RT-PCR analysis of autophagy associated genes atg5 and atg12 in wt and ush2armc1 larvae. Two pools of 10 larvae were used per genotype (*P < 0.05, unpaired t-test). (D) Western blot analysis of pooled larvae, using antibodies directed at several markers of autophagy, revealed differences in expression of these markers between wt and ush2armc1 mutants. Anti-actin was used as a loading control. OS, outer segments; ONL, outer nuclear layer; OPL, outer plexiform layer; INL, inner nuclear layer. Scale bars = 25 μm.
|
