
FIGURE
Figure 3
Figure 3
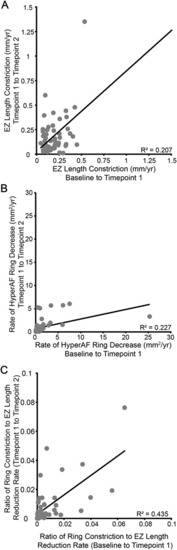
Inter-relatedness of progression between metrics. While there is a strong correlation between the rate of change observed in the first and second observation periods for both EZ length constriction ( |
Expression Data
Expression Detail
Antibody Labeling
Phenotype Data
Phenotype Detail
Acknowledgments
This image is the copyrighted work of the attributed author or publisher, and
ZFIN has permission only to display this image to its users.
Additional permissions should be obtained from the applicable author or publisher of the image.
Full text @ Hum. Mol. Genet.