|
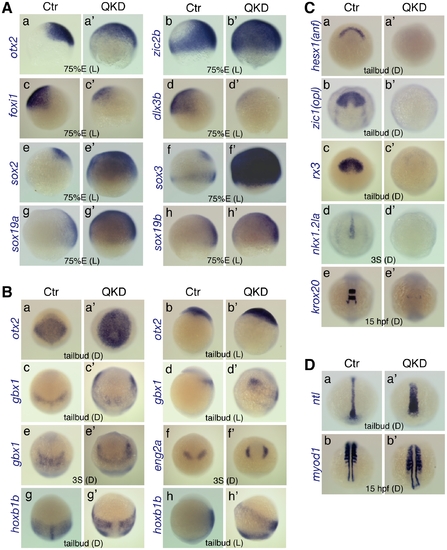
Defects in embryo patterning, early neural development, and C&E movements in the QKD embryos. Comparison of the gene expression profiles between uninjected control (Ctr) and QKD embryos. (A) Ventral expansion of early neural gene expression (otx2 [a], zic2b [b] and sox2/3/19a/19b [e?h]), and reduced expression of non-neural ectoderm marker genes (foxi1 [c] and dlx3b [d]) at 75%E. (B) Altered expression patterns of neural genes at the tailbud and 3-somite stages. The expression domains of gbx1 (c?e), eng2a (f) and hoxb1b (g, h) were anterolaterally shifted, which encompass the otx2 expression domain (a, b). (C) Defective neural development revealed by the loss of expression of neural marker genes, hesx1 (a), zic1 (b), rx3 (c), nkx1.2la (d) and krox20 (e). Residual expression of krox20 was observed in r5-derived neural crest cells. (D) Wider mesoderm structures with a shortened axis revealed by mesodermal marker genes, ntl (a) and myod1 (b). The stages and embryo orientations are shown in each panel: E, epiboly stage; S, somite stage; L, lateral view with dorsal to the right; D, dorsal view with anterior to the top.
|

