FIGURE SUMMARY
Title

Resolving primary pathomechanisms driving idiopathic-like spinal curvature using a new katnb1 scoliosis model

Authors
Meyer-Miner, A., Van Gennip, J.L.M., Henke, K., Harris, M.P., Ciruna, B.
Source
Full text @ iScience

katnb1 mutant zebrafish exhibit defining attributes of IS

(A–D) Representative lateral views of calcein-stained katnb1mh102/+ (A & A’; N = 2, n = 24) and katnb1mh102/mh102 (B & B’; N = 2, n = 13) fish at 12 dpf (6 mm average length); and of katnb1mh102/+ (C & C’; N = 4, n = 53) and katnb1mh102/mh102 (D & D’; N = 4, n = 18) fish at 17 dpf (7 mm average length). Note onset of spinal curvatures in katnb1mh102/mh102 zebrafish (arrowheads) in the absence of congenital vertebral malformations. Squares indicate location of higher magnification images (A′–D′). Scale bars, 1 mm.

(E–H) Three dimensional microCT projections of representative 3-month-old katnb1mh102/+ (E & F; N = 2, n = 5) and katnb1mh102/mh102 (G & H; N = 17, n = 68) zebrafish viewed in sagittal (E & G) and coronal (F & H) planes.

(I–L) Quantification of curve severity, direction, and position along the DV (I, J) and ML (K, L) axes of katnb1mh102/mh102 mutant zebrafish. (I, K) Graphs depicting spinal curvatures of individual mutant fish: x axis indicates vertebral position of curve apices along the rostral to caudal plane; Y axis indicates magnitude of curvature (Cobb angle). Positive Cobb angles represents kyphotic curves in the DV axis and rightward curves in the ML axis. Negative Cobb angle represents lordotic curves in the DV axis and leftward curves in the ML axis. (J, L) Graphs depicting sums of all Cobb angle measurements in DV (J, p = 0.72) and ML (L, p = 0.31) axes for male and female katnb1mh102/mh102 fish (N = 6, n = 47). Statistical analyses were performed using student’s t test.

(M and O) Quantification of curve severity, direction, and position along the DV (M) and ML (O) axes of ptk7ahsc9/hsc9 mutant zebrafish.

(N and P) Quantification of curve severity as a measure of total Cobb angle, comparing katnb1mh102/mh102 (N = 17, n = 68) and ptk7ahsc9/hsc9 (N = 8, n = 17) mutant animals along the DV (N, p = 0.613) and ML (P, p = 0.0014) axis.

PHENOTYPE:
Fish:
Observed In:
Stage Range: Days 7-13 to Adult

katnb1 mutants exhibit cilia defects in foxj1-positive cell lineages

(A–H) SEM imaging of the rhombencephalic ventricle in brains dissected from 3-month-old katnb1mh102/+ (A; N = 3, n = 9) and katnb1mh102/mh102 (B; N = 4, n = 11) adults; 6-week-old katnb1mh102/+ (C; N = 3, n = 9) katnb1mh102/mh102 (D; N = 3, n = 8) and ptk7ahsc9/hsc9 (E; N = 3, n = 9) fish; and 3-week-old katnb1mh102/+ (F; N = 4, n = 14), katnb1mh102/mh102 (G; N = 4, n = 14) and ptk7ahsc9/hsc9 (H; N = 3, n = 8) juveniles. Scale bars, 5 μm.

(I and J) Quantification of bulk CSF movement as measured by the distance fluorescent dye travels along the spinal canal (in millimeters; mm), 2 h post-injection into the brain ventricles of experimental fish. (I) katnb1mh102/+ (A; N = 3, n = 37) and katnb1mh102/mh102 (A; N = 3, n = 36) zebrafish exhibit no difference in bulk CSF flow rates at 2 weeks of age (p = 0.4828). (J) Significant differences in bulk CSF flow were observed between katnb1mh102/+ (B; N = 2, n = 19) and katnb1mh102/mh102 mutant (B; N = 2, n = 12) fish at 3 weeks of age (p = 0.0000006829). Statistical analysis was performed using a two tailed t test.

Re-introduction of Katnb1 in foxj1a-positive cell lineages suppresses scoliosis

(A) Schematic of Tg(foxj1a::katnb1) construct.

(B–E) SEM images of the rhombencephalic ventricle of 3 month old katnb1mh102/mh102 (B & C; N = 4, n = 11) and Tg(foxj1a::katnb1); katnb1mh102/mh102 (D & E; N = 4, n = 10) fish. (B, D) Scale bar, 20 μm. Square indicates higher magnification location. (C, E) Scale bar, 5 μm.

(F–I) Representative microCT projections of 3-month-old katnb1mh102/mh102 (F & G; N = 17, n = 68) and Tg(foxj1a::katnb1); katnb1mh102/mh102 (H & I; N = 8, n = 73) mutant zebrafish in sagittal (F & H) and coronal (G & I) planes.

katnb1 mutants exhibit choroid plexus cilia defects at 21 dpf

(A–F) Representative maximum intensity Z-stack projections of confocal micrographs, acquired through dorsally oriented whole mount brains that were dissected from 21dpf katnb1mh102/+ (A; N = 6, n = 14) and katnb1mh102/mh102 (D; N = 6, n = 25) fish, and immunostained for polyglutamylated tubulin. Squares indicate regions of interest, chosen for higher magnification analyses of the forebrain ChP (B & E) and rhombencephalic ChP (C & F) of katnb1mh102/+ control (B & C; N = 8, n = 60) and katnb1mh102/mh102 mutant (E & F; N = 8, n = 32) animals. Scale bars, 50 μm. Tel: telencephalon, TeO: optic tectum, CC: cerebellum.

(G–J) Higher magnification regions (as indicated in B, C, E & F) of cilia on the forebrain ChP (G & H) and rhombencephalic ChP (I & J) of katnb1mh102/+ control (G & I) and katnb1mh102/mh102 mutant (H & J) brains. Scale bars, 25 μm.

katnb1 mutants exhibit severe fChP and rChp cilia defects at 30 dpf

(A–D) Representative maximum intensity Z-stack projections of confocal micrographs, acquired through dorsally oriented whole mount brains that were dissected from 30 dpf katnb1mh102/+ control (A–B; N = 11, n = 70) and katnb1mh102/mh102 mutant (C-D; N = 11, n = 88) fish, and immunostained for polyglutamylated tubulin. Forebrain ChP (A, C) and rhombencephalic ChP (B, D) are shown. Squares represent higher magnification images of fChP (A′, C′) and rChP (B′, D′). Scale bars, 50 μm (A & B) and 20 μm (A' & B′).

Analysis of Sspo localization and RF formation in 21dpf katnb1 mutant brains

(A–L) Representative maximum intensity Z-stack projections of confocal micrographs, acquired through dorsally oriented whole mount brains that were dissected from 21dpf katnb1mh102/+ control (A, C–G; N = 7, n = 54) and katnb1mh102/mh102 mutant (B, H-L; N = 7, n = 36) fish, and immunostained for polyglutamylated tubulin (green) and Sspo (magenta). Squares indicate regions of interest, chosen for higher magnification analyses of areas surrounding the fChP (C, H); subcommisural organ (SCO; D, I); optic tectum (TeO; E, J); rChP (F, K); and medulla spinalis (G, L). (C–L) Inverted, higher magnification images of Sspo immunostaining. (C–G) Normal Sspo localization is observed in katnb1mh102/+ control animals, including the presence of a RF (arrows). (H–L) katnb1mh102/mh102 mutant images, exhibiting abnormal Sspo accumulation at the fChP and rChP (double arrowheads), and the presence of a RF (arrows). Scale bars, 100 μm (A & B) and 50 μm (C–L).

PHENOTYPE:
Fish:
Observed In:
Stage: Days 21-29

Analysis of Sspo localization and RF formation in 30dpf katnb1 mutant brains

(A–L) Representative maximum intensity Z-stack projections of confocal micrographs, acquired through dorsally oriented whole mount brains that were dissected from 21dpf katnb1mh102/+ control (A, C–G; N = 9, n = 61) and katnb1mh102/mh102 mutant (B, H–L; N = 12, n = 82) fish, and immunostained for polyglutamylated tubulin (green) and Sspo (magenta). Squares indicate regions of interest, chosen for higher magnification analyses of areas surrounding the fChP (C, H); SCO (D, I); TeO (E, J); rChP (F, K); and medulla spinalis (G, L). (C–L) Inverted, higher magnification images of Sspo immunostaining. (C–G) katnb1mh102/+ control animals exhibit normal Sspo localization and RF is present (arrows). (H–L) katnb1mh102/mh102 mutant images, exhibiting abnormal Sspo accumulation at the fChP and rChP (double arrowheads), and the presence of an intact RF (arrows). Scale bars, 100 μm (A & B) and 50 μm (C–L).

PHENOTYPE:
Fish:
Observed In:
Stage: Days 30-44

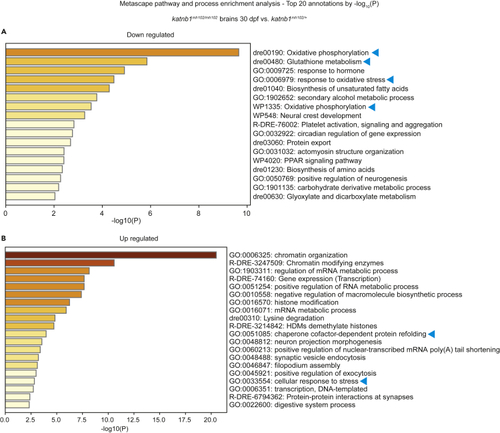
Metascape enrichment analysis of differentially expressed genes in katnb1 mutant brains

(A and B) Metascape pathway enrichment analysis using the Danio rerio database for significantly downregulated genes (A) and significantly upregulated genes (B) identified in bulk mRNA sequencing analysis of 30 dpf brains, dissected from katnb1mh102/mh102 mutants compared with katnb1mh102/+sibling controls. Arrows indicate cell-stress response pathways discussed in the text.

ZFIN is incorporating published figure images and captions as part of an ongoing project. Figures from some publications have not yet been curated, or are not available for display because of copyright restrictions.

Acknowledgments
This image is the copyrighted work of the attributed author or publisher, and ZFIN has permission only to display this image to its users. Additional permissions should be obtained from the applicable author or publisher of the image. Full text @ iScience