
|
Figure 2
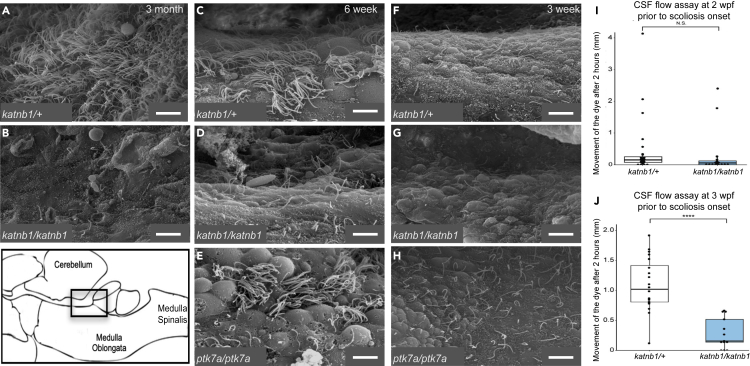
(A–H) SEM imaging of the rhombencephalic ventricle in brains dissected from 3-month-old
(I and J) Quantification of bulk CSF movement as measured by the distance fluorescent dye travels along the spinal canal (in millimeters; mm), 2 h post-injection into the brain ventricles of experimental fish. (I)