
|
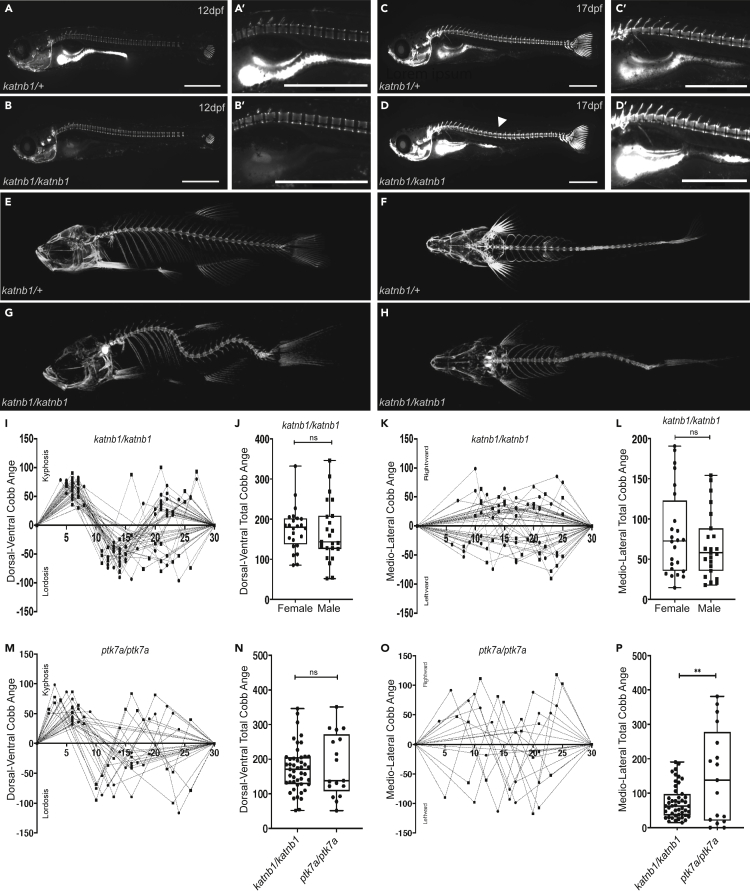
Figure 1
(A–D) Representative lateral views of calcein-stained
(E–H) Three dimensional microCT projections of representative 3-month-old
(I–L) Quantification of curve severity, direction, and position along the DV (I, J) and ML (K, L) axes of
(M and O) Quantification of curve severity, direction, and position along the DV (M) and ML (O) axes of
(N and P) Quantification of curve severity as a measure of total Cobb angle, comparing