FIGURE SUMMARY
Title

Asxl1 C-terminal mutation perturbs neutrophil differentiation in zebrafish

Authors
Fang, X., Xu, S., Zhang, Y., Xu, J., Huang, Z., Liu, W., Wang, S., Yen, K., Zhang, W.
Source
Full text @ Leukemia

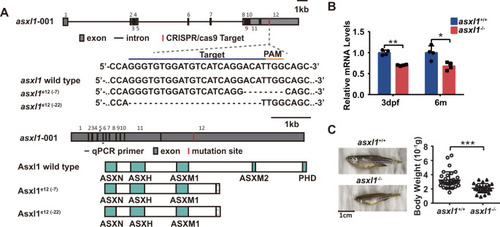
Genomic editing using CRISPR/Cas9 to generate <italic>asxl1</italic> C-terminally truncated mutant zebrafish.

A Site-specific targeting for CRISPR/Cas9 cleavage within exon 12 of the zebrafish asxl1 gene. Alignment of nucleotide sequences from wild-type and mutant asxl1 alleles in asxl1e12 (−7) and asxl1e12 (−22) zebrafish lines. Dashes in DNA sequences are the nucleotides deleted during repair of CRISPR/Cas9-induced double-strand breaks. PAM protospacer adjacent motif. CRISPR/cas9-induced asxl1 frameshift mutations predicted to lead to C-terminally truncated proteins. Truncated proteins predicted from mutant alleles asxl1e12 (−7) and asxl1e12 (−22) lack the last two domains (ASXM2 and PHD). B qRT-PCR comparing expression of asxl1 in asxl1+/+ and mutant asxl1−/− in 3 days postfertilization (dpf) larvae and adult kidney marrow (3 dpf, 3 dpf larvae tails, n ≥ 10 per group, performed with four replicates; 6 m, 6-month kidney marrow, n = 4 per genotype; two-tailed Student’s t test, *p < 0.05, **p < 0.01, ***p < 0.001; error bars, mean ± standard deviation (SD)). C Gross appearance of asxl1−/− zebrafish compared with asxl1+/+ littermates (at 1.5 years). Body weights of asxl1+/+ and asxl1−/ zebrafish (scale bar, 1 cm; asxl1+/+, n = 33; asxl1−/−, n = 24; two-tailed Student’s t test, *p < 0.05, **p < 0.01, ***p < 0.001, error bars, mean ± SD).

EXPRESSION / LABELING:
Gene:
Fish:
Anatomical Terms:
Stage Range: Protruding-mouth to Adult
PHENOTYPE:
Fish:
Observed In:
Stage Range: Protruding-mouth to Adult

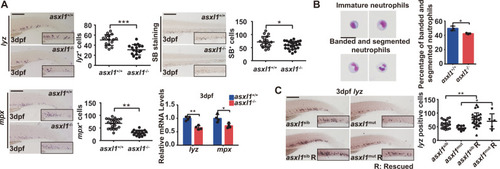
Zebrafish <italic>asxl1</italic> mutant has impaired neutrophil maturation.

A Decreased lyz and mpx expression and decreased SB+ cells in asxl1 mutants. WISH for lyz, mpx, and SB staining (3 dpf; scale bar, 200 μm; black boxes show enlarged details; lyz WISH, asxl1+/+, n = 16, asxl1−/−, n = 17; mpx WISH, asxl1+/+, n = 22, asxl1−/−, n = 17; SB staining, asxl1+/+, n = 19, asxl1−/−, n = 24; two-tailed Student’s t test, *p < 0.05, **p < 0.01, ***p < 0.001; error bars, mean ± SD). qRT-PCR comparison of lyz and mpx expression between wild type and mutant (3 dpf larvae, n ≥ 10 per group, performed with four replicates; two-tailed Student’s t test, *p < 0.05, **p < 0.01, ***p < 0.001; error bars, mean ± SD). B May–Grünwald–Giemsa staining of neutrophils from 4 dpf embryos and quantification of mature neutrophils by morphology. Neutrophils were collected from over 400 embryos of each genotype asxl1+/+ or asxl1−/−. After staining, 100 cells were randomly chosen for further calculation. This process was repeated three times for statistical tests (scale bars, 10 μm; two-tailed Student’s t test, *p < 0.05, **p < 0.01, ***p < 0.001; error bars, mean ± SD). C Reduced lyz expression rescued by asxl1 expression. Left panel: WISH of lyz (3 dpf) after injection of asxl1 mRNA. Right panel: quantification of lyz+ cells in asxl1+/+ and asxl1−/− tails (0.1 ng mRNA/embryo; scale bar, 200 μm; black boxes show enlarged images; asxl1sib, n = 19, asxl1mut, n = 10, asxl1sib R, n = 27, asxl1mut = 6. R, mRNA injected; one-way ANOVA followed by LSD Fisher’s post hoc test, *p < 0.05, **p < 0.01, ***p < 0.001; error bars, mean ± SD).

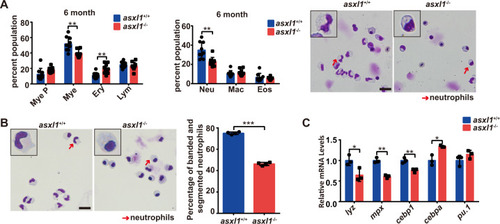
C-terminal <italic>asxl1</italic> mutation leads to MDS like with neutrophilic dysplasia in adult zebrafish.

A Proportion of hematopoietic cells in whole kidney marrow of 6-month-old asxl1+/+, asxl1−/− (n = 9 and n = 10, respectively; two-tailed Student’s t test, *p < 0.05, **p < 0.01, ***p < 0.001; error bars, mean ± SD). Mye P myeloid progenitors, Mye mature myeloid cells, Ery erythrocytes, Lym lymphocytes, Neu neutrophils, Mac macrophages, Eos eosinophils. May–Grünwald–Giemsa staining of whole kidney marrow from 6-month-old asxl1+/+ and asxl1−/− (scale bar, 20 μm; black boxes show enlarged details of neutrophils; red arrows, neutrophils). B May–Grünwald–Giemsa staining of neutrophils from kidney marrow. Neutrophils were quantified by morphology. Neutrophils were collected from ten adult fish of each genotype asxl1+/+ or asxl1−/−. After staining, 500 cells were randomly chosen for further calculation. This process was repeated three times for statistical tests (scale bar, 20 μm; black boxes show enlarged details of neutrophils; red arrows, neutrophils; two-tailed Student’s t test, *p < 0.05, **p < 0.01, ***p < 0.001, error bars, mean ± SD). C qRT-PCR comparing expression of myeloid markers in sorted neutrophils from asxl1+/+ and asxl1−/−. Neutrophils were collected from ten adult fish of each genotype asxl1+/+ or asxl1−/−. qPCR was performed with three technical replicates (two-tailed Student’s t test, *p < 0.05, **p < 0.01, ***p < 0.001, error bars, mean ± SD) (color figure online).

Zebrafish adult <italic>asxl1</italic> mutants progress to CMML-like or AML-like phenotypes.

A May–Grünwald–Giemsa staining of peripheral blood (PB) and whole kidney marrow (KM) cells presentative five fish with CMML-like and two fish with AML-like phenotypes (scale bar, 20 μm; black boxes show enlarged details of macrophages and myeloid progenitors; red arrows, macrophages; yellow arrows, myeloid progenitors). B Hematoxylin and eosin staining of paraffin-embedded sections of liver from representative asxl1+/+ (a, b) and asxl1−/− (c–f) (scale bar, 40 μm; black box, macrophage infiltration; green arrow, vacuolated cytoplasm; red arrow, gaps; yellow arrow, fibrosis) (color figure online).

<italic>asxl1</italic> mutated cells intrinsically induce leukemogenesis and are transplantable.

A Schematic of the experimental procedure. Wild-type fish were irradiated at 24 Gy 2 days before transplantation. Whole kidney marrow cells were prepared from 1-year stage asxl1+/+ and asxl1−/− donors and were dilute to 105/μL. Each recipient was injected with 3 μL donor kidney marrow cells. Transplanted fish were raised in sterile water. After 18 days, surviving fish were collected for analysis (dpt, days posttransplantation). B May–Grünwald–Giemsa staining of whole kidney marrow of successful transplanted fish (asxl1+/+, n = 3; asxl1−/−, n = 4; scale bar, 20 μm; black boxes show enlarged details of neutrophils and macrophages/monocytes; green arrows, neutrophils; red arrow, macrophages). C Proportion of hematopoietic cells in whole kidney marrow of transplanted fish (asxl1+/+, n = 3; asxl1−/−, n = 4; two-tailed Student’s t test, *p < 0.05, **p < 0.01, ***p < 0.001, error bars, mean ± SD). Mye P myeloid progenitors, Mye mature myeloid cells, Ery erythrocytes, Lym lymphocytes, Neu neutrophils, Mac macrophages, Eos eosinophils (color figure online).

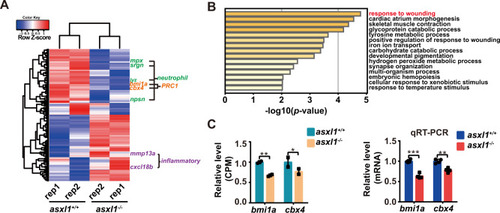
Expression of neutrophil and PRC1 markers decreased with <italic>asxl1</italic> mutation.

A Heat map of differentially expressed genes (false discovery rate < 0.05; exact test) in 3 dpf asxl1−/− compared to asxl1+/+ via RNA-seq. Neutrophil markers (green), PRC1 members (orange), and inflammatory response associated genes (purple) were highlighted. Rep replicate. B Gene ontology (GO) enrichment analysis of biological processes based on differentially expressed genes identified through RNA-seq (hypergeometric test). C Expression of bmi1a and cbx4 from RNA-seq (n = 20 per replicate, CPM count-per-million; exact test, *false discovery rate (FDR) < 0.05, **FDR < 0.01, ***FDR < 0.001; error bars, mean ± SD). qRT-PCR comparing expression of bmi1a and cbx4 in asxl1+/+ and asxl1−/− in 3 dpf larvae (n ≥ 10 per group, performed with four replicates; two-tailed Student’s t test, *p < 0.05, **p < 0.01, ***p < 0.001; error bars, mean ± SD) (color figure online).

EXPRESSION / LABELING:
Genes:
Fish:
Anatomical Term:
Stage: Protruding-mouth
PHENOTYPE:
Fish:
Observed In:
Stage: Protruding-mouth

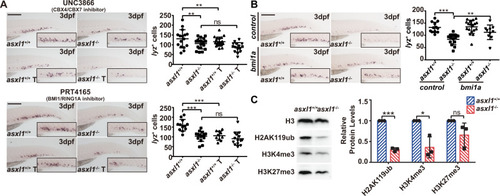
Inhibition of PRC1 components is associated with disruption of neutrophils development.

A WISH for lyz (3 dpf) after UNC3866 treatment showing lyz+ cells decreased after 50 μM UNC3866 treatment. Quantification of lyz+ cells in asxl1+/+ and asxl1−/− tails (scale bar, 200 μm; black boxes show enlarged images; asxl1+/+, n = 16, asxl1−/−, n = 18, asxl1+/+ T, n = 20, asxl1−/− T, n = 15; one-way ANOVA followed by LSD Fisher’s post hoc test, *p < 0.05, **p < 0.01, ***p < 0.001; error bars, mean ± SD). T treated, ns not significant. WISH of lyz (3 dpf) after 10 μM PRT4165 treatment showing lyz+ cells decreased after PRT4165 treatment. Quantification of lyz+ cells in asxl1+/+ and asxl1−/− tails (scale bar, 200 μm; black boxes show enlarged images; asxl1+/+, n = 12, asxl1−/−, n = 15, asxl1+/+ T, n = 10, asxl1−/− T, n = 14; one-way ANOVA followed by LSD Fisher’s post hoc test, *p < 0.05, **p < 0.01, ***p < 0.001; error bars, mean ± SD). T treated, ns not significant. B WISH for lyz (3 dpf) after bmi1a mRNA injection showing reduced lyz expression was rescued by bmi1a mRNA injection. Quantification of lyz+ cells in asxl1+/+ and asxl1−/− tails (about 0.1 ng mRNA/embryo; scale bar, 200 μm; black boxes show enlarged images; control: asxl1+/+, n = 12, asxl1−/−, n = 18; bmi1a: asxl1+/+, n = 18, asxl1−/−, n = 10; one-way ANOVA followed by LSD Fisher’s post hoc test, *p < 0.05, **p < 0.01, ***p < 0.001; error bars, mean ± SD; T treated, ns not significant). C Western blot of H2AK119ub, H3K4me3 and H3K27me3 in 2 dpf asxl1+/+ and asxl1−/− embryos and quantification of Western blot data (input embryos: about ten embryos/well, performed with three replicates; two-tailed Student’s t test, ns not significant; error bars, mean ± SD, internal control, H3).

EXPRESSION / LABELING:
Antibodies:
Fish:
Anatomical Term:
Stage: Long-pec
PHENOTYPE:
Fish:
Observed In:
Stage: Long-pec

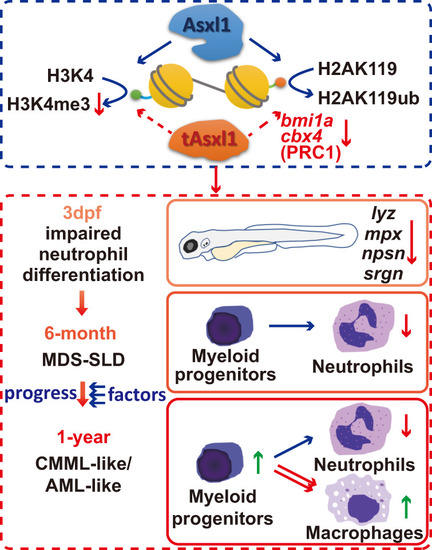
Schematic diagram of Asxl1 mutations resulting in myeloid malignancies in zebrafish.

In our model, C-terminally truncated with asxl1 mutations specifically blocked neutrophil differentiation. The mutants initially exhibited an MDS-like phenotype with neutrophilic dysplasia, and some mutants progressed to more severe phenotypes, similar to CMML/AML disease. Dysregulation of bmi1a may be a reason for leukemogenesis in asxl1 mutants. Asxl1 wild-type Asxl1 protein, tAsxl1 truncated Asxl1 protein.

ZFIN is incorporating published figure images and captions as part of an ongoing project. Figures from some publications have not yet been curated, or are not available for display because of copyright restrictions.

Acknowledgments
This image is the copyrighted work of the attributed author or publisher, and ZFIN has permission only to display this image to its users. Additional permissions should be obtained from the applicable author or publisher of the image. Full text @ Leukemia