IMAGE

Fig. 6

ID
ZDB-IMAGE-210804-19
Genes
Source
Figures for Fang et al., 2021
Image
Figure Caption

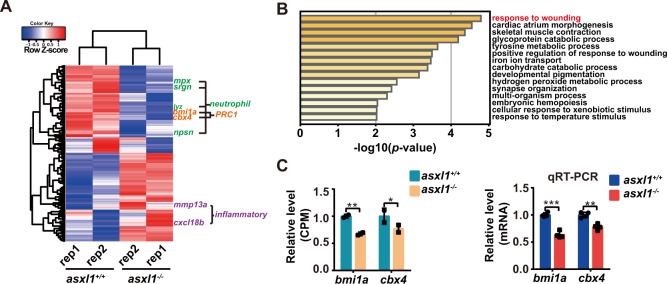
Fig. 6 Expression of neutrophil and PRC1 markers decreased with <italic>asxl1</italic> mutation.

A Heat map of differentially expressed genes (false discovery rate < 0.05; exact test) in 3 dpf asxl1−/− compared to asxl1+/+ via RNA-seq. Neutrophil markers (green), PRC1 members (orange), and inflammatory response associated genes (purple) were highlighted. Rep replicate. B Gene ontology (GO) enrichment analysis of biological processes based on differentially expressed genes identified through RNA-seq (hypergeometric test). C Expression of bmi1a and cbx4 from RNA-seq (n = 20 per replicate, CPM count-per-million; exact test, *false discovery rate (FDR) < 0.05, **FDR < 0.01, ***FDR < 0.001; error bars, mean ± SD). qRT-PCR comparing expression of bmi1a and cbx4 in asxl1+/+ and asxl1−/− in 3 dpf larvae (n ≥ 10 per group, performed with four replicates; two-tailed Student’s t test, *p < 0.05, **p < 0.01, ***p < 0.001; error bars, mean ± SD) (color figure online).

Figure Data
Acknowledgments
This image is the copyrighted work of the attributed author or publisher, and ZFIN has permission only to display this image to its users. Additional permissions should be obtained from the applicable author or publisher of the image. Full text @ Leukemia