IMAGE

Fig. 2

ID
ZDB-IMAGE-210804-16
Genes
Source
Figures for Fang et al., 2021
Image
Figure Caption

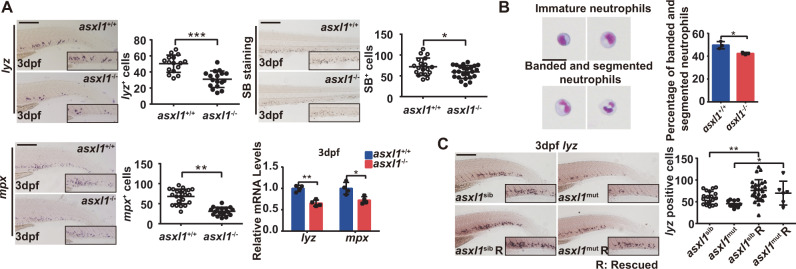
Fig. 2 Zebrafish <italic>asxl1</italic> mutant has impaired neutrophil maturation.

A Decreased lyz and mpx expression and decreased SB+ cells in asxl1 mutants. WISH for lyz, mpx, and SB staining (3 dpf; scale bar, 200 μm; black boxes show enlarged details; lyz WISH, asxl1+/+, n = 16, asxl1−/−, n = 17; mpx WISH, asxl1+/+, n = 22, asxl1−/−, n = 17; SB staining, asxl1+/+, n = 19, asxl1−/−, n = 24; two-tailed Student’s t test, *p < 0.05, **p < 0.01, ***p < 0.001; error bars, mean ± SD). qRT-PCR comparison of lyz and mpx expression between wild type and mutant (3 dpf larvae, n ≥ 10 per group, performed with four replicates; two-tailed Student’s t test, *p < 0.05, **p < 0.01, ***p < 0.001; error bars, mean ± SD). B May–Grünwald–Giemsa staining of neutrophils from 4 dpf embryos and quantification of mature neutrophils by morphology. Neutrophils were collected from over 400 embryos of each genotype asxl1+/+ or asxl1−/−. After staining, 100 cells were randomly chosen for further calculation. This process was repeated three times for statistical tests (scale bars, 10 μm; two-tailed Student’s t test, *p < 0.05, **p < 0.01, ***p < 0.001; error bars, mean ± SD). C Reduced lyz expression rescued by asxl1 expression. Left panel: WISH of lyz (3 dpf) after injection of asxl1 mRNA. Right panel: quantification of lyz+ cells in asxl1+/+ and asxl1−/− tails (0.1 ng mRNA/embryo; scale bar, 200 μm; black boxes show enlarged images; asxl1sib, n = 19, asxl1mut, n = 10, asxl1sib R, n = 27, asxl1mut = 6. R, mRNA injected; one-way ANOVA followed by LSD Fisher’s post hoc test, *p < 0.05, **p < 0.01, ***p < 0.001; error bars, mean ± SD).

Figure Data
Acknowledgments
This image is the copyrighted work of the attributed author or publisher, and ZFIN has permission only to display this image to its users. Additional permissions should be obtained from the applicable author or publisher of the image. Full text @ Leukemia