- Title
-
Live Imaging and Gene Expression Analysis in Zebrafish Identifies a Link between Neutrophils and Epithelial to Mesenchymal Transition
- Authors
- Freisinger, C.M., Huttenlocher, A.
- Source
- Full text @ PLoS One
|
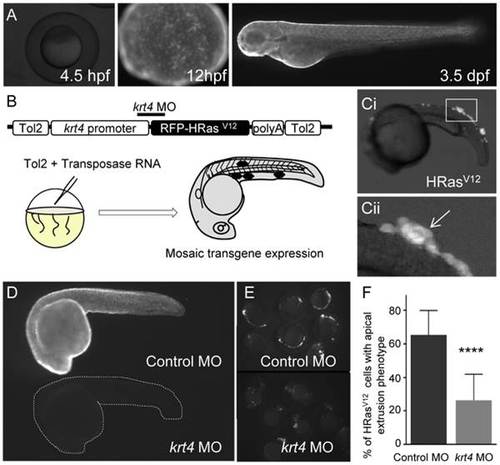
Early HRasV12 expression in epithelial cells induces cell extrusion. (A) Lateral fluorescent images of transgenic krt4-GFP embryos at 4.5 hpf, 12 hpf and 3 dpf. (B) Schematic of the Tol2 flanked:krt4:RFP-HRasV12 construct+transposase one-cell stage injection resulting in mosaic RFP-HRas expression by 24 hpf (black hexagons). (C) (i) Lateral fluorescent image of a 24 hpf live H-RasV12 expressing embryo. (ii) High-magnification view of the inset in (i) indicating the apical cell extrusion phenotype (white arrow). (D) Fluorescent images of live 24 hpf krt4:GFP transgenic embryos injected with either control MO (Top) or Krt4 MO (bottom dashed outline) at 24 hpf illustrating that the krt4 MO reduces transgene levels in a stable transgenic line. (E) Fluorescent images of live 24 hpf embryos transiently expressing HRasV12 injected with either control MO or krt4 MO illustrating that the krt4 MO reduces transgene levels in embryos with mosaic transgene expression. (F) Quantification of cell extrusion (one representative graph shown n = 3) of HRasV12 expressing cells from control MO and Krt4 MO injected embryos shows a significant decrease in the cell extrusion in embryos injected with the Krt4 MO. **** = p<.0001. EXPRESSION / LABELING:
|
|
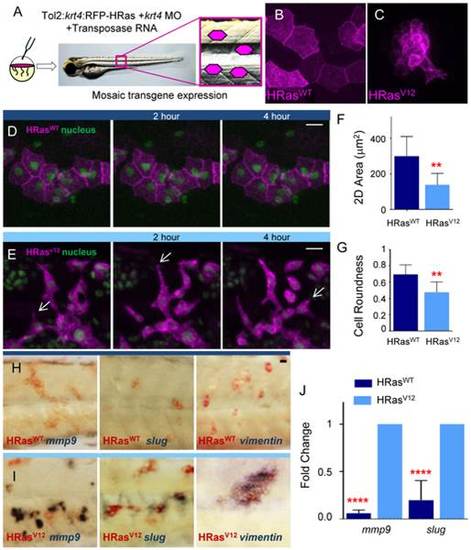
HRasV12 expression in epithelial cells induces cell shape and genetic changes associated with EMT in vivo (A) Schematic of Tol2 flanked:krt4:RFP-HRas+transposase one-cell stage injection resulting in mosaic expression. (B?C) Fluorescent Z stack projections of HRasWT and HRasV12 expressing epithelial cells (magenta) in the trunk region of 3.5 dpf larvae (illustrated in A). (D?E) Lateral fluorescent images, from live imaging, of 3.5 dpf embryos co-expressing GFP-H2B to label the nuclei and either HRasWT (D) or HRasV12 (E) at 0, 2 hr and 4 hr time points. Arrows in E indicate cell extensions. (F) Quantification of the 2D area of H-RasWT and H-RasV12 expressing cells shows a significant decrease in the 2D area of HRasV12 expressing cells compared to controls. (G) Quantification of the cell roundness of HRasWT and HRasV12 expressing cells shows a significant decrease in the cell roundness of HRasV12 expressing cells compared to controls. (H?I) Double label WMISH with HRasWT (H) and HRasV12 (I) transcript labeled in red and mmp9, slug, and vimentin transcript label in blue illustrating that mmp9, slug, and vimentin expression are induced in RFP-HRasV12 compared to control RFP-HRasWT expressing larvae. (J) Quantitative RT-PCR (one representative graph shown n = 5) indicates a statistically significant increase in mmp9 and slug transcripts in HRasV12 transformed cells compared to control HRasWT expressing cells. hr = hour, dpf = days post fertilization, ** = p<.005, **** = p<.0001 scale bars = 20 microns. |
|
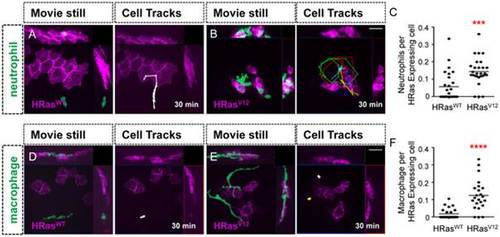
Leukocytes are recruited to HRasV12 expressing epithelial cells. (A?B) Analysis of time-lapse movies of control HRasWT expressing epithelial cells (A and D) and HRasV12 expressing epithelial cells (B and E) in 3.5 dpf transgenic mpx:GFP (green neutrophils) larvae (A?B) and 3.5 dpf transgenic mpeg:Dendra (green macrophage) larvae (D?E). For cell tracks leukocyte migration was tracked every 2 minutes for 30 minutes. (C) Quantification of A?B (as a ratio of neutrophils per transformed cell) confirms a statistically significant increase in neutrophil recruitment to HRasV12 expressing cells compared to HRasWT expressing cells. (F) Quantification of D?E (as a ratio of macrophages per transformed cell) confirms a statistically significant increase in macrophage recruitment to HRasV12 expressing cells when compared to macrophages recruited to HRasWT expressing cells. dpf = days post fertilization, scale bar = 20 microns, *** = p<.001 **** = p<.0001. |
|
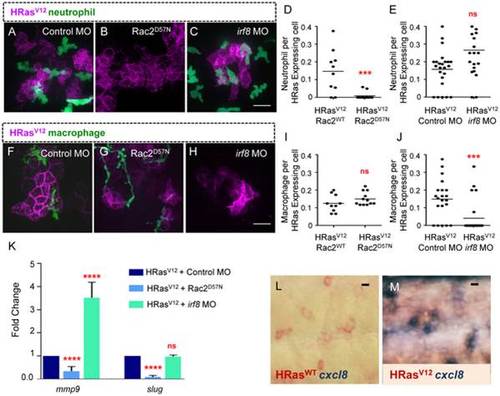
Neutrophils, but not macrophages, mediate EMT related gene expression in HRasV12 expressing epithelial cells. (A?C) Fluorescent Z stack projections of live 3.5 dpf transgenic mpx:GFP (green neutrophils) control MO injected (A), Rac2D57N (B) and irf8 MO (C) larvae expressing HRasV12. (D?E) Quantification of neutrophil recruitment (as a ratio of neutrophils per transformed cell) shows a significant decrease in neutrophil recruitment to HRasV12 expressing cells in RacD57N embryos when compared to controls (D), no significant change was observed in neutrophil recruitment in irf8 morphant larvae compared to control (E). (F?H) Fluorescent Z stack projections of live 3.5 dpf of transgenic mpeg:Dendra (green macrophages) control MO injected (F), Rac2D57N (G) and irf8 MO (H) larvae expressing HRasV12. (I?J) Quantification of macrophage recruitment (as a ratio of macrophages per transformed cell) shows a significant decrease in macrophage recruitment to HRasV12 expressing cells in irf8 morphants compared to controls (D). No significant change was observed in macrophage recruitment in Rac2D57N larvae compared to control (E). (K) Quantitative RT-PCR (one representative graph shown n = 4) indicates a statistically significant decrease in mmp9 and slug transcripts in transformed cells from Rac2D57N larvae compared to control MO injected larvae while no significant decrease was seen in mmp9 and slug transcripts in transformed cells from irf8 Mo injected larvae compared to controls. (L?M) Double label WMISH with HRasWT (A) and HRasV12 (B) transcript labeled in red and cxcl8 transcript label in blue. cxcl8 expression is induced in HRasV12 expressing larvae compared to control HRasWT expressing larvae. *** = P<.001, **** = P<.0001, ns = not significant. Scale bar = 20 microns. |
|
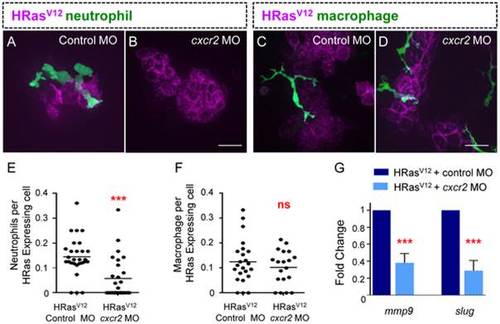
Cscr2 is required for EMT related gene expression in HRasV12 expressing epithelial cells. (A?B) Fluorescent Z stack projections of live 3.5 dpf transgenic mpx:GFP (green neutrophils) control MO injected (A) and cxcr2 morphant (B). (C?D) Fluorescent Z stack projections of live 3.5 dpf transgenic mpeg:Dendra (green macrophages), control MO injected (C) and cxcr2 morphant (D). (E) Quantification of A?B (as a ratio of neutrophils per transformed cell) reveals a significant decrease in neutrophil recruitment to HRasV12 expressing cells in cxcr2 MO injected larvae compared to control. (F) Quantification of C?D (as a ratio of macrophages per transformed cell) shows that macrophage numbers at HRasV12 expressing cells in cxcr2 MO injected larvae is similar to macrophage numbers at HRasV12 expressing cells in control larvae. (G) Quantitative RT-PCR (one representative graph shown n = 4) indicates a statistically significant decrease in mmp9 and slug transcripts in transformed cells from cxcr2 MO injected larvae when compared to control MO injected larvae. *** = P<.001, ns = not significant. Scale bar = 20 microns. |
|
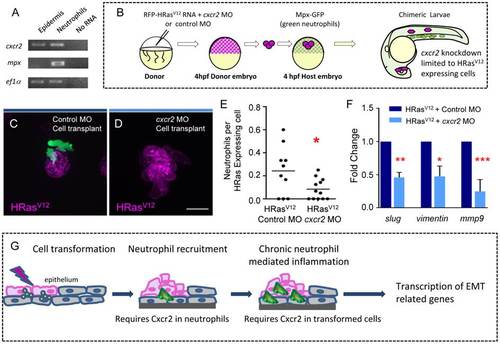
Cxcr2 signaling in HRasV12 transformed epithelial cells is required for neutrophil recruitment and EMT related gene expression. (A) For analysis of tissue specific Cxcr2 expression TRAP was performed on 3.5 dpf transgenic krt4-EGFP-L10a and mpx-EGFP-L10a larvae and one-step RT-PCR was performed. cxcr2 expression is observed in the epidermis and in neutrophils. mpx expression is only observed in neutrophils supporting that there is not neutrophil contamination in the epidermal samples. (B) Schematic diagram to illustrate the cell transplantation used to generate chimeric HRasV12 expressing larvae in which the transformed cells express either control MO or Cxcr2 MO. (C?D) Fluorescent Z stack projections of live 3.5 dpf of transgenic mpx:GFP (green neutrophils) larvae with control MO in the HRasV12 expressing cells (C) or with cxcr2 MO within the HRasV12 expressing cells (D). (E) Quantification of C?D (as a ratio of neutrophils per transformed cell) shows a statistically significant decrease in neutrophil recruitment to HRasV12 expressing cells that have cxcr2 MO compared to HRasV12 expressing cells that have control MO. (F) Quantitative RT-PCR (one representative graph shown n = 3) indicates a statistically significant decrease in slug, vimentin and mmp9 transcripts in HRasV12 expressing cells that have cxcr2 MO compared to HRasV12 expressing cells with control MO. (G) Schematic illustrating the requirement for Cxcr2 in neutrophils for initial neutrophil recruitment to transformed cells as well as a cell autonomous function of Cxcr2 in transformed cells to mediate changes associated with EMT. * = P<.05, ** = P<.01, *** = P<.001. Scale bar = 20 microns. EXPRESSION / LABELING:
|

