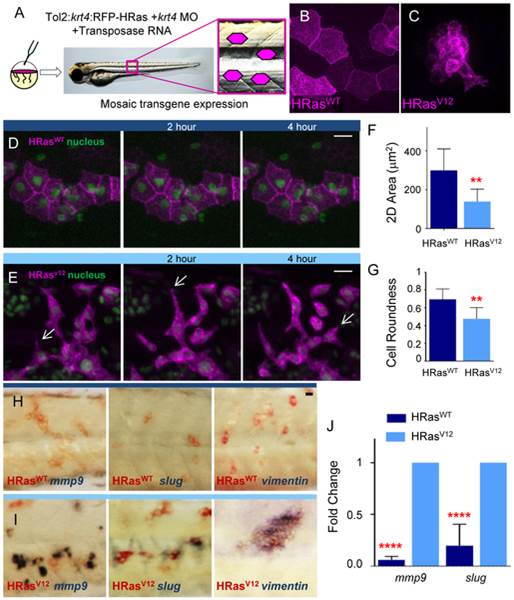
Fig. 2 HRasV12 expression in epithelial cells induces cell shape and genetic changes associated with EMT in vivo
(A) Schematic of Tol2 flanked:krt4:RFP-HRas+transposase one-cell stage injection resulting in mosaic expression. (B–C) Fluorescent Z stack projections of HRasWT and HRasV12 expressing epithelial cells (magenta) in the trunk region of 3.5 dpf larvae (illustrated in A). (D–E) Lateral fluorescent images, from live imaging, of 3.5 dpf embryos co-expressing GFP-H2B to label the nuclei and either HRasWT (D) or HRasV12 (E) at 0, 2 hr and 4 hr time points. Arrows in E indicate cell extensions. (F) Quantification of the 2D area of H-RasWT and H-RasV12 expressing cells shows a significant decrease in the 2D area of HRasV12 expressing cells compared to controls. (G) Quantification of the cell roundness of HRasWT and HRasV12 expressing cells shows a significant decrease in the cell roundness of HRasV12 expressing cells compared to controls. (H–I) Double label WMISH with HRasWT (H) and HRasV12 (I) transcript labeled in red and mmp9, slug, and vimentin transcript label in blue illustrating that mmp9, slug, and vimentin expression are induced in RFP-HRasV12 compared to control RFP-HRasWT expressing larvae. (J) Quantitative RT-PCR (one representative graph shown n = 5) indicates a statistically significant increase in mmp9 and slug transcripts in HRasV12 transformed cells compared to control HRasWT expressing cells. hr = hour, dpf = days post fertilization, ** = p<.005, **** = p<.0001 scale bars = 20 microns.

