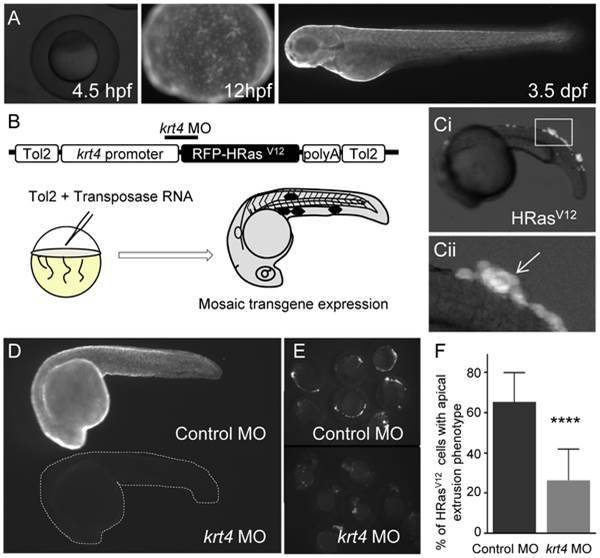
Fig. 1 Early HRasV12 expression in epithelial cells induces cell extrusion.
(A) Lateral fluorescent images of transgenic krt4-GFP embryos at 4.5 hpf, 12 hpf and 3 dpf. (B) Schematic of the Tol2 flanked:krt4:RFP-HRasV12 construct+transposase one-cell stage injection resulting in mosaic RFP-HRas expression by 24 hpf (black hexagons). (C) (i) Lateral fluorescent image of a 24 hpf live H-RasV12 expressing embryo. (ii) High-magnification view of the inset in (i) indicating the apical cell extrusion phenotype (white arrow). (D) Fluorescent images of live 24 hpf krt4:GFP transgenic embryos injected with either control MO (Top) or Krt4 MO (bottom dashed outline) at 24 hpf illustrating that the krt4 MO reduces transgene levels in a stable transgenic line. (E) Fluorescent images of live 24 hpf embryos transiently expressing HRasV12 injected with either control MO or krt4 MO illustrating that the krt4 MO reduces transgene levels in embryos with mosaic transgene expression. (F) Quantification of cell extrusion (one representative graph shown n = 3) of HRasV12 expressing cells from control MO and Krt4 MO injected embryos shows a significant decrease in the cell extrusion in embryos injected with the Krt4 MO. **** = p<.0001.

