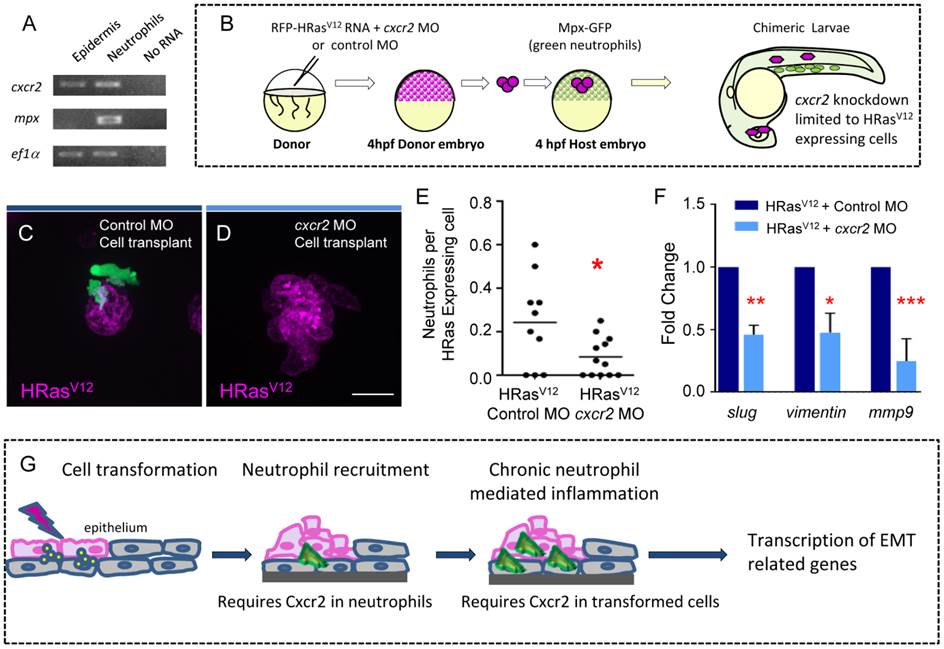
Fig. 6 Cxcr2 signaling in HRasV12 transformed epithelial cells is required for neutrophil recruitment and EMT related gene expression.
(A) For analysis of tissue specific Cxcr2 expression TRAP was performed on 3.5 dpf transgenic krt4-EGFP-L10a and mpx-EGFP-L10a larvae and one-step RT-PCR was performed. cxcr2 expression is observed in the epidermis and in neutrophils. mpx expression is only observed in neutrophils supporting that there is not neutrophil contamination in the epidermal samples. (B) Schematic diagram to illustrate the cell transplantation used to generate chimeric HRasV12 expressing larvae in which the transformed cells express either control MO or Cxcr2 MO. (C?D) Fluorescent Z stack projections of live 3.5 dpf of transgenic mpx:GFP (green neutrophils) larvae with control MO in the HRasV12 expressing cells (C) or with cxcr2 MO within the HRasV12 expressing cells (D). (E) Quantification of C?D (as a ratio of neutrophils per transformed cell) shows a statistically significant decrease in neutrophil recruitment to HRasV12 expressing cells that have cxcr2 MO compared to HRasV12 expressing cells that have control MO. (F) Quantitative RT-PCR (one representative graph shown n = 3) indicates a statistically significant decrease in slug, vimentin and mmp9 transcripts in HRasV12 expressing cells that have cxcr2 MO compared to HRasV12 expressing cells with control MO. (G) Schematic illustrating the requirement for Cxcr2 in neutrophils for initial neutrophil recruitment to transformed cells as well as a cell autonomous function of Cxcr2 in transformed cells to mediate changes associated with EMT. * = P<.05, ** = P<.01, *** = P<.001. Scale bar = 20 microns.

