- Title
-
Depletion of Retinoic Acid Receptors Initiates a Novel Positive Feedback Mechanism that Promotes Teratogenic Increases in Retinoic Acid
- Authors
- D'Aniello, E., Rydeen, A.B., Anderson, J.L., Mandal, A., and Waxman, J.S.
- Source
- Full text @ PLoS Genet.
|
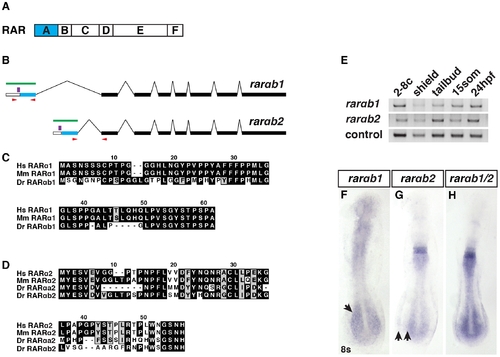
RARαb1 and RARαb2 sequences and expression. (A) Schematic representation of RAR domains. Blue box indicates the variable A domain, which is different between RARαb1 and the previously identified RARαb2 splice variant. (B) Schematic representation of RARαb1 and RARαb2 genomic organization (adapted from Ensemble_v9). Blue bars represent the first exon, which encodes the respective A domains. White bars represent the 52 UTRs. Black bars represent the exons that are common to the two variants. Green bars represent the target of the antisense probes used for ISH. Red arrows indicate the position of the primers used to perform RT-PCR. Purple bars indicate the position of the morpholino target sequences. (C) Alignments of the A domains of human (Hs) RARα1, mouse (Mm) RARα1, and zebrafish (Dr) RARαb1. The presence of this previously unrecognized splice variant was recently confirmed in the latest zebrafish genome assembly (Ensemble Zv9). There is no RARαa splice variant 1 ortholog in the zebrafish genome. (D) Alignments of the A domains of Hs RARα2, Mm RARα2, Dr RARαa2, and Dr RARαb2. (E) Reverse transcriptase PCR (RT-PCR) for the zebrafish rarαb isoforms. max was used as the control. -RT control did not reveal genomic contamination (data not shown). (F) Rarαb1 is expressed in the ventral anterior of the embryo and the presomitic paraxial mesoderm (arrow) at the 8 somite (s) stage. (G) Rarαb2 is expressed in rhombomeres 5 and 6, the spinal cord and the posterior lateral plate mesoderm (LPM). Arrows indicate the space between the posterior spinal cord and LPM expression domains. (H) Together, the expression patterns recapitulate a previously reported rarαb probe (referred to as rarαb1/2), which detects both isoforms [24]. In F?H, embryos are flatmounted and are dorsal views with anterior up. |
|
RARαb1 deficient embryos have enlarged hearts with increased CM number. (A, B) Hearts from control sibling and RARαb1 deficient Tg(-5.1myl7:DsRed-NLS)f2 embryos. Images are frontal views. Red indicates ventricle. Green indicates atrium. (C?H) ISH for CM differentiation marker genes. (I?L) ISH for CM progenitor marker genes. Brackets in I and J indicate length of nkx2.5 expression. Arrows in K indicate posterior and anterior limits of the hand2 expression domains in the LPM. In C?L, views are dorsal with anterior up. (M) Mean CM number at 48 hpf. (N) qPCR for CM differentiation marker gene expression at 48 hpf. (O) Areas of the amount of cells expressing the CM differentiation marker genes at the 20 s and 22 s stages. (P) qPCR for CM differentiation marker gene and nkx2.5 expression at 24 hpf. (Q) qPCR for CM progenitor gene expression at the 8 s stage. Asterisk in all graphs indicate a statistically significant difference compared to controls (p<0.05). Error bars in all graphs indicate standard deviation. EXPRESSION / LABELING:
PHENOTYPE:
|
|
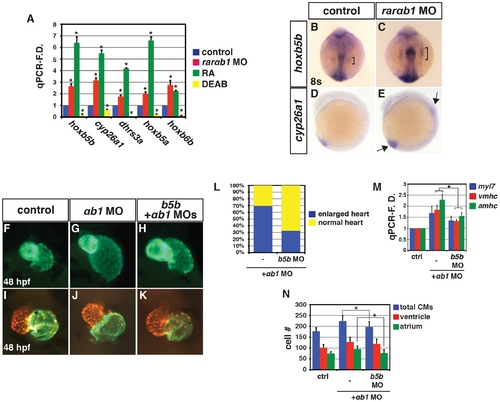
RARαb1 deficient embryos have increased expression of RA signaling responsive genes. (A) qPCR for RA signaling responsive gene expression at the 8 s stage. (B, C) ISH for hoxb5b expression at the 8 s stage. Bracket indicates length of expression in the LPM. Views are dorsal with anterior up. (D, E) ISH for cyp26a1 expression at the 8 s stage. Arrows in E indicate increased expression in the tailbud and spinal cord. Views are lateral with anterior up and dorsal right. (F?H) Fronto-lateral views of Tg(-5.1myl7:GFP)f2 embryos at 48 hpf of control sibling, RARαb1 deficient embryos, and RARαb1+Hoxb5b deficient embryos. (I?K) Hearts from control sibling, RARαb1 deficient embryos and RARαb1+Hoxb5b deficient Tg(-5.1myl7:DsRed-NLS)f2 embryos. Images are frontal views. Red indicates ventricle. Green indicates atrium. (L) Percentage of control+rarαb1 MOs (n = 60), hoxb5b+rarαb1 MOs (n = 68) showing enlarged and normal hearts. (M) qPCR for CM differentiation gene expression at 48 hpf. (N) Mean CM number at 48 hpf. EXPRESSION / LABELING:
PHENOTYPE:
|
|
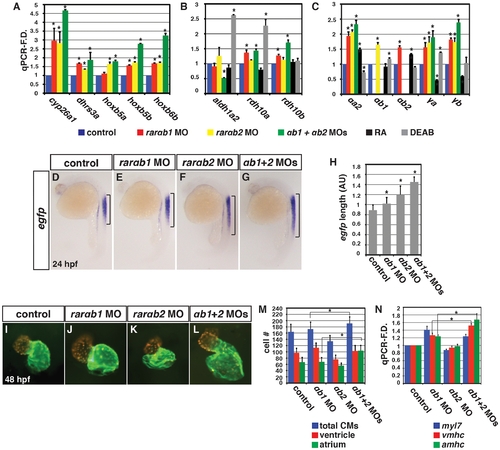
Concurrent depletion of RARαb1 and RARαb2 promotes increased RA signaling and atrial CM number. qPCR for (A) RA signaling responsive gene, (B) RA metabolizing gene, and (C) zebrafish rar expression in control sibling, RARαb1 deficient, RARαb2 deficient, RARαb1+RARαb2 (suboptimal doses) deficient, RA treated, and DEAB treated embryos at the 8 s stage. (D?G) ISH for egfp expression in Tg(12XRARE-ef1a:EGFP)sk72 embryos. Brackets indicate the length of egfp expression in the spinal cord. (H) Measurements of the length in arbitrary units (AU) of egfp expression in the spinal cord of Tg(12XRARE-ef1a:EGFP)sk72 embryos. (I?L) Hearts from control and RARαb depleted Tg(-5.1myl7:DsRed-NLS)f2 embryos. Images are frontal views. Red indicates ventricle. Green indicates atrium. (M) Mean CM number from Tg(-5.1myl7:DsRed-NLS)f2 hearts at 48 hpf. (N) qPCR for CM marker gene expression at 48 hpf. While modest increases in vmhc expression in RARαb1+RARαb2 deficient embryos were observed relative to RARαb1 (suboptimal dose) deficient embryos, corresponding increases in ventricular CM number were not observed. |
|
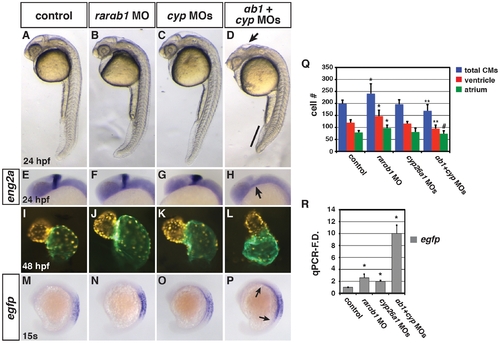
Concurrent depletion of RARαb1 and Cyp26a1 results in phenotypes resembling RA treatment. (A?D) Control sibling, RARαb1 deficient, Cyp26a1 deficient, and RARαb1+Cyp26a1 deficient embryos. A suboptimal dose of the cyp26a1 MOs was used that did not cause ostensible defects for these experiments. In D, arrow indicates loss of the MHB and line indicates shortened tail. Images are lateral views with dorsal right and anterior up. (E?H) ISH for eng2a, which marks the MHB. 100% of (E) control sibling (n = 11), (F) RARαb1 deficient (n = 7), and (G) Cyp26a1 deficient (n = 7) had eng2a expression. 85% of (H) RARαb1+Cyp26a1 deficient embryos (n = 7) had a complete absence of eng2a expression (arrow in H). Equivalent results were obtained using pax2a, which also marks the MHB (data not shown). (I?L) Hearts from control sibling, RARαb1 deficient, Cyp26a1 deficient, and RARαb1+Cyp26a1 deficient Tg(-5.1myl7:DsRed-NLS)f2 embryos. Images are frontal views. Red indicates ventricle. Green indicates atrium. (M?P) ISH for egfp in Tg(β-actin:GDBD-RLBD)cch1;Tg(UAS:EGFP) embryos. Lateral views with dorsal right and anterior up. (Q) Mean CM number at 48 hpf and (R) qPCR for egfp expression at 15 s in control sibling, RARαb1 deficient, Cyp26a1 deficient, and RARαb1+Cyp26a1 deficient embryos. Double asterisks in Q indicate a statistically significant difference relative to control and RARαb1 deficient embryos. Pound sign in Q indicates a statistically significant difference relative to RARαb1 deficient embryos. EXPRESSION / LABELING:
|
|
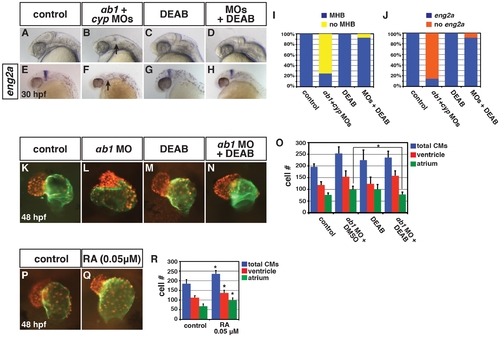
Reduction of RA in RARαb1 deficient embryos can rescue developmental defects. (A?H) Control sibling, RARαb1+Cyp26a1 deficient, control sibling treated with DEAB, and RARαb1+Cyp26a1 treated with DEAB embryos. In B and F, arrows indicates loss of the MHB and eng2a expression. Images are lateral views with dorsal right and anterior up. (I) Percentage of control sibling (n = 16), RARαb1+Cyp26a1 deficient embryos (n = 16), control sibling embryos treated with DEAB (n = 13), and RARαb1+Cyp26a1 deficient embryos treated with DEAB (n = 14) that had a MHB based on morphology. (J) Percentage of control sibling (n = 17), RARαb1+Cyp26a1 deficient embryos (n = 14), control sibling embryos treated with DEAB (n = 15), and RARαb1+Cyp26a1 deficient embryos treated with DEAB (n = 12) that had eng2a expression at the MHB. (K?N) Hearts from Tg(-5.1myl7:DsRed-NLS)f2 control sibling, RARαb1 deficient, DEAB treated, and DEAB+RARαb1deficient embryos. Images are frontal views. Red indicates ventricle. Green indicates atrium. (O) Mean CM number at 48 hpf. (P,Q) Hearts from Tg(-5.1myl7:DsRed-NLS)f2 control sibling embryos and Tg(-5.1myl7:DsRed-NLS)f2 embryos treated with a low concentration of RA. Images are frontal views. Red indicates ventricle. Green indicates atrium. (R) Mean CM number at 48 hpf. |
|
Comparison of RARαb1 and RARαb2 expression. (A, D, G, J, M) rarαb1 expression. (B, E, H, K, N) rarαb2 expression. (C, F, I, L, O) rarαb1/2 is a probe that recognizes both isoforms 24. Arrows in J and L indicate anterior ventral expression. Arrowheads in K and L indicate hindbrain and anterior spinal cord expression. Arrows in M and N indicate differences in the expression of the developing tail. In A-O, all views are lateral. In D-O, dorsal is to the right. |
|
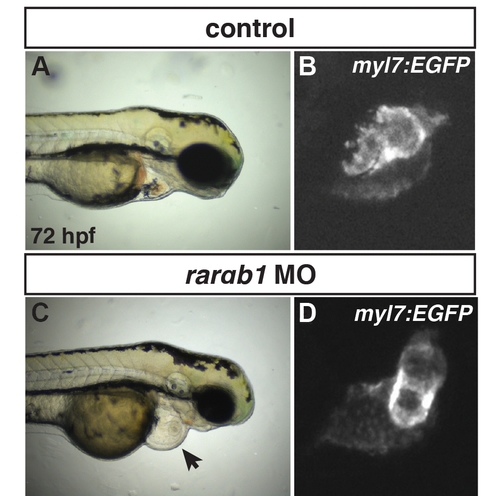
RARαb1 deficient embryos have enlarged hearts at 72 hpf. (A) Control sibling Tg(-5.1myl7:GFP)f2 embryo. (C) RARαb1 deficient Tg(-5.1myl7:GFP)f2 embryo. Arrow in C indicates pericardial edema with enlarged heart. (B, D) Higher magnification images of the fluorescent hearts of the Tg(-5.1myl7:GFP)f2 control sibling and RARαb1 deficient Tg(-5.1myl7:GFP)f2 embryos in A and C. Images are lateral views with dorsal up and anterior right. |
|
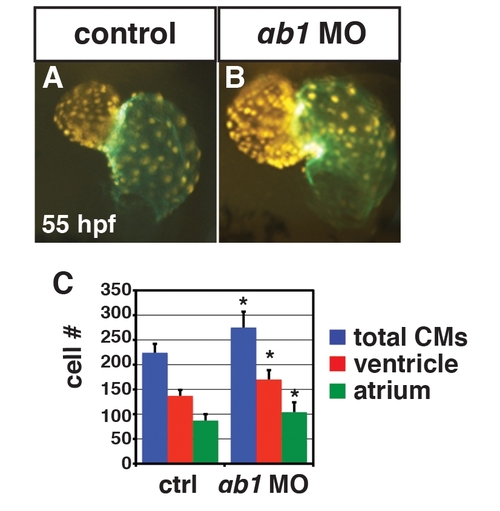
RARαb1 deficient embryos have enlarged hearts with increased CM number at 55 hpf. (A, B) Hearts from control sibling and RARαb1 deficient Tg(-5.1myl7:DsRed-NLS)f2 embryos at 55 hpf. Images are frontal views. Red indicates ventricle. Green indicates atrium. (C) Mean CM number at 48 hpf. |
|
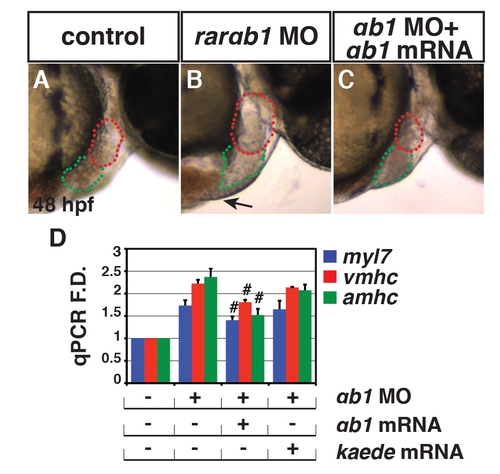
Specificity controls for the translation blocking rarαb1 MO. (A?C) Control sibling, RARαb1 deficient, and RARαb1 deficient+rarαb1 mRNA injected embryos. Images are lateral views with anterior right at 48 hpf. Red outline indicates ventricles. Green outline indicates atria. Arrow in B indicates edema often found in RARαb1 deficient embryos, which is not found in RARαb1 deficient+rarαb1 mRNA injected embryos (C). (D) qPCR for CM differentiation marker genes at 48 hpf in control sibling, RARαb1 deficient, RARαb1 deficient embryos+rarαb1 mRNA, and RARαb1 deficient embryos+kaede (control) mRNA injected embryos at 48 hpf. Pound sign indicates a statistically significant difference compared to RARαb1 deficient and RARαb1 deficient embryos+kaede (control) mRNA injected embryos (p<0.05). |
|
A suboptimal dose of hoxb5b MO does not affect CM cell number at 48hpf. (A, B) Hearts from control sibling and Hoxb5b deficient Tg(-5.1myl7:DsRed-NLS)f2 embryos at 48hpf. Images are frontal views. Red indicates ventricle. Green indicates atrium. (C) Mean CM number at 48hpf. |
|
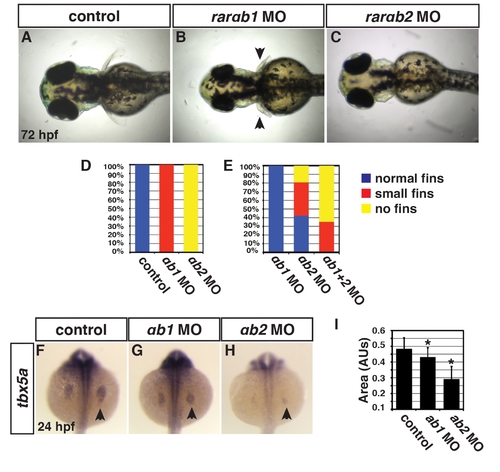
RARαb1 and RARαb2 function partially redundantly to promote forelimb development. (A?C) Control sibling, RARαb1 deficient, and RARαb2 deficient embryos. Images in A?C are dorsal views with anterior to the left. Arrows in B indicate smaller forelimbs. (D) Percentage of control sibling (n = 20), RARαb1 deficient (n = 20), and RARαb2 deficient (n = 20) embryos with normal, small or no forelimbs. An optimal dose of the rarαb1 and rarαb2 MOs was used for experiments in D. (E) Percentage of embryos with normal, small, or no forelimbs after injection with a suboptimal dose of rarαb1 MO (n = 28), a suboptimal dose of rarαb2 MO (n = 26), and co-injected with suboptimal doses of the rarαb1 and rarαb2 MOs (n = 17). (F?H) ISH of tbx5a, a forelimb marker, in control sibling, RARαb1 deficient, RARαb2 deficient embryos. Arrows in F?H indicate tbx5a expression the LPM. (I) Areas of the amount of cells expressing the tbx5a at 24 hpf. |
|
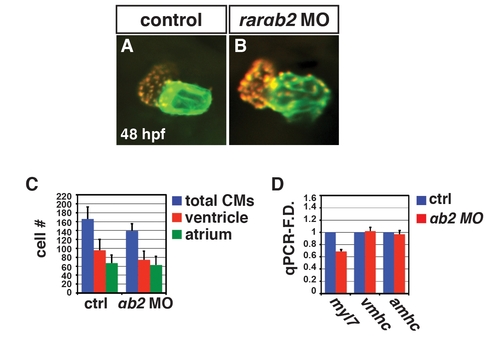
RARαb2 deficient embryos do not have enlarged hearts. (A, B) Hearts from control sibling and RARαb2 deficient Tg(-5.1myl7:DsRed-NLS) embryos at 48 hpf. Images are frontal views. Red indicates ventricle. Green indicates atrium. (C) Mean CM number from the hearts of control sibling and RARαb2 deficient Tg(-5.1myl7:DsRed-NLS) embryos at 48 hpf. (D) qPCR for CM marker gene expression in control sibling and RARαb2 deficient embryos at 48 hpf. We do find a modest decrease in CM number (C) and myl7 expression (D), which is likely due to a very modest amount of MO-induced toxicity. |
|
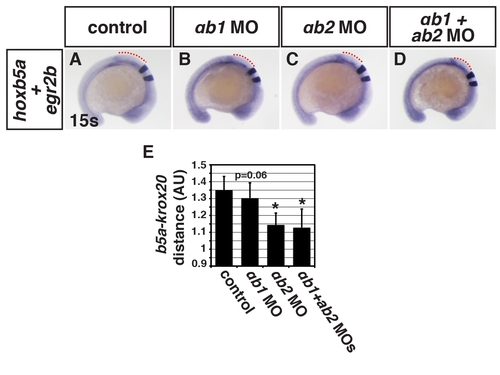
Patterning of the spinal cord is affected in the RARαb1+RARαb2 deficient embryos. (A?D) Hoxb5a (spinal cord) and egr2b (rhombomeres 3+5) expression in control (n = 32), RARαb1 deficient (n = 23), RARαb2 deficient (n = 16), and RARαb1+RARαb2 deficient embryos (n = 19). (E) Measurements of the distance in arbitrary units (AU) between hoxb5a and egr2b expression. Expression of hoxb5a in the spinal cord is expanded rostrally. The rostral expansion of hoxb5a in RARαb1 deficient embryos trends similarly as RARαb2 deficient and RARαb1+RARαb2 deficient embryos, but it is not statistically significant (p = 0.06). |
|
RARαb1 and RARαb2 function partially redundantly to promote proper heart development. (A?D) Control sibling, RARαb1 deficient (suboptimal dose), RARαb2 deficient (suboptimal dose), and RARαb1+RARαb2 (suboptimal doses) deficient embryos at the 72 hpf. Arrow in D indicates pericardial edema and the enlarged heart. |
|
Rarαb1 and rarαb2 mRNA overexpression do not significantly affect RA responsive genes. (A?I) ISH for the RA responsive genes cyp26a1, dhrs3a, and hoxb5b at 8 s. (A, D, G) Control sibling, (B, E, H) rarαb1 mRNA, and (C, F, I) rarαb2 mRNA injected embryos. Injection of either rarαb mRNA did not inhibit RA responsive gene expression. Images in A?C are lateral views with anterior up and dorsal right. Images in D?I are dorsal views with anterior up. (J) qPCR for RA responsive genes cyp26a1, hoxb5a, hoxb8b, dhrs3a at 8 s. (K) Mean CM number from control sibling, rarαb1 mRNA, and rarαb2 mRNA injected Tg(-5.1myl7:DsRed-NLS)f2 embryos. (L) Transfection of HEK 293 cells with DNA for the zebrafish rarαb1 and rarαb2 and pGL3-12XRARE-ef1α:renilla luciferase vector with and without RA treatment. Fold difference in luminescence is indicated in arbitrary units (AU) and reflects the ratio of renilla luciferase (RL) to firefly (FL) luciferase. |
|
Rar expression in RARαb1, RARαb2, or RARαb1+2 deficient embryos. (A, B) ISH for rarαb1 in RARαb2 deficient embryos. (C, D) ISH for rarαb2 in RARαb1 deficient embryos. (E, F) ISH for rarαa2 in RARαb1+2 deficient embryos. (G, H) ISH for rarγa in RARαb1+2 deficient embryos. (I, L) ISH for rarγb in Rarαb1+2 deficient embryos. rar expression is often expanded in the tailbud region of embryos deficient for the other RAR homologs, while additional regions also appear to have increased or low levels of ectopic expression. All views are lateral with dorsal right at 8 s. Arrows in A?H indicate distance of expression in the tail. Arrowheads in F, H, L indicate regions of increased or ectopic expression. |
|
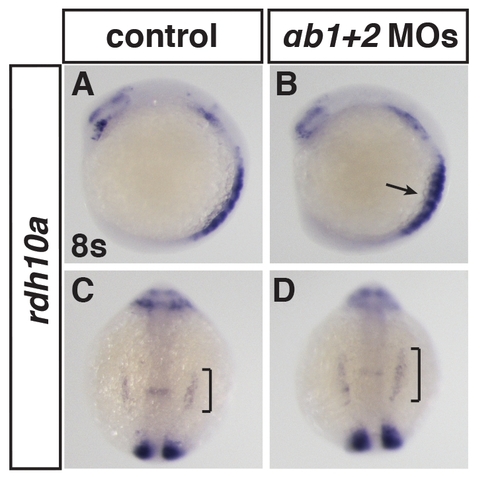
Rdh10a expression in RARαb1+2 deficient embryos. (A?D) ISH for rdh10a in RARαb1+2 deficient embryos at 8 somites. (A, B) Lateral views with dorsal right. (C, D) Dorsal views with anterior up. Brackets indicate expansion of rdh10a in the ALPM. Arrow indicates increased expression in the somites. |
|
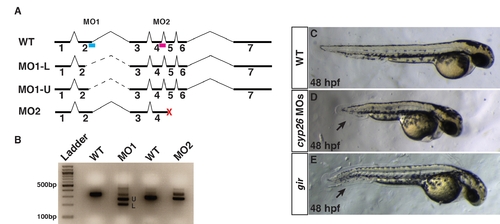
Characterization of cyp26a1 splice-blocking MOs used in experiments. (A) Schematic of the cyp26a1 locus and the intron-exon boundaries targeted by the different cyp26a1 MOs. Blue bar indicates MO1. Red bar indicates MO2. MO1 primarily causes usage of two in-frame cryptic splice sites. Dashed lines indicate the alternate introns cause by the cryptic splices induced from MO1. MO2 causes the introduction of a premature stop codon (red X). (B) RT-PCR for the WT cyp26a1 transcripts and alternate transcripts induced from the different MOs. U and L indicate bands depicted in A. (C) Control sibling embryo. (D) Embryos injected with cocktail of cyp26a1 MO1+2. Co-injection of cyp26a1 MO1 and MO2 causes a phenotype equivalent to or stronger than the cyp26a1/giraffe (gir) mutant (E). Injection of the individual MOs causes the phenotypes consistent with cyp26a1 loss of function at low frequency (data not shown). A suboptimal dose of the cyp26a1 MO cocktail was used for functional interaction experiments with RARαb1 (Figure 4). Arrows in D and E indicate shortened tail. Views in C?E are lateral with anterior right. |
|
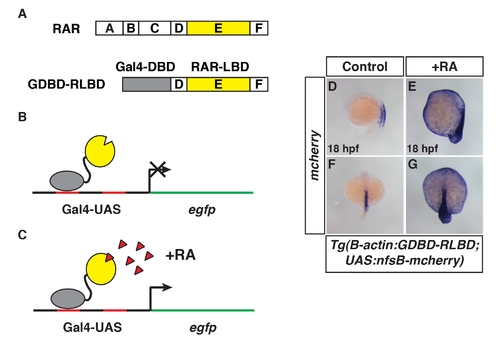
Characterization of the novel transgenic RA sensorline. (A) Schematic of the RAR domains and the Gal4 DNA binding domain (GDBD)/RARαb ligand binding domain (RLBD) fusion protein. Grey indicates the GDBD. Yellow indicates the RLBD. D is a linker domain and F is a domain with unknown function (as in Figure 1). (B, C) Schematics representing the GDBD-RLBD fusion acting on the Gal4-UAS:EGFP transgene. The GDBD-RLBD is expressed under the β-actin promoter. (B) In the absence of RA, egfp is not expressed. (C) In the presence of RA (red triangles), the GDBD-RLBD is able to promoted egfp (UAS responsive gene) transcription. (D?G) Tg(β-actin:GDBD-RLB);Tg(UAS:nfsB-mcherry) embryos are responsive to RA treatment. ISH for mcherry. Equivalent results were found when the Tg(β-actin:GDBD-RLB) line was crossed to Tg(UAS:EGFP) fish (data not shown) as were used for experiments in Figure 5. More detailed characterization of the stable transgenic RA sensor lines is reported in 31. (D, E) Lateral views with dorsal right. (F, G) Dorsal views. In images D?G anterior is up. |

