
|
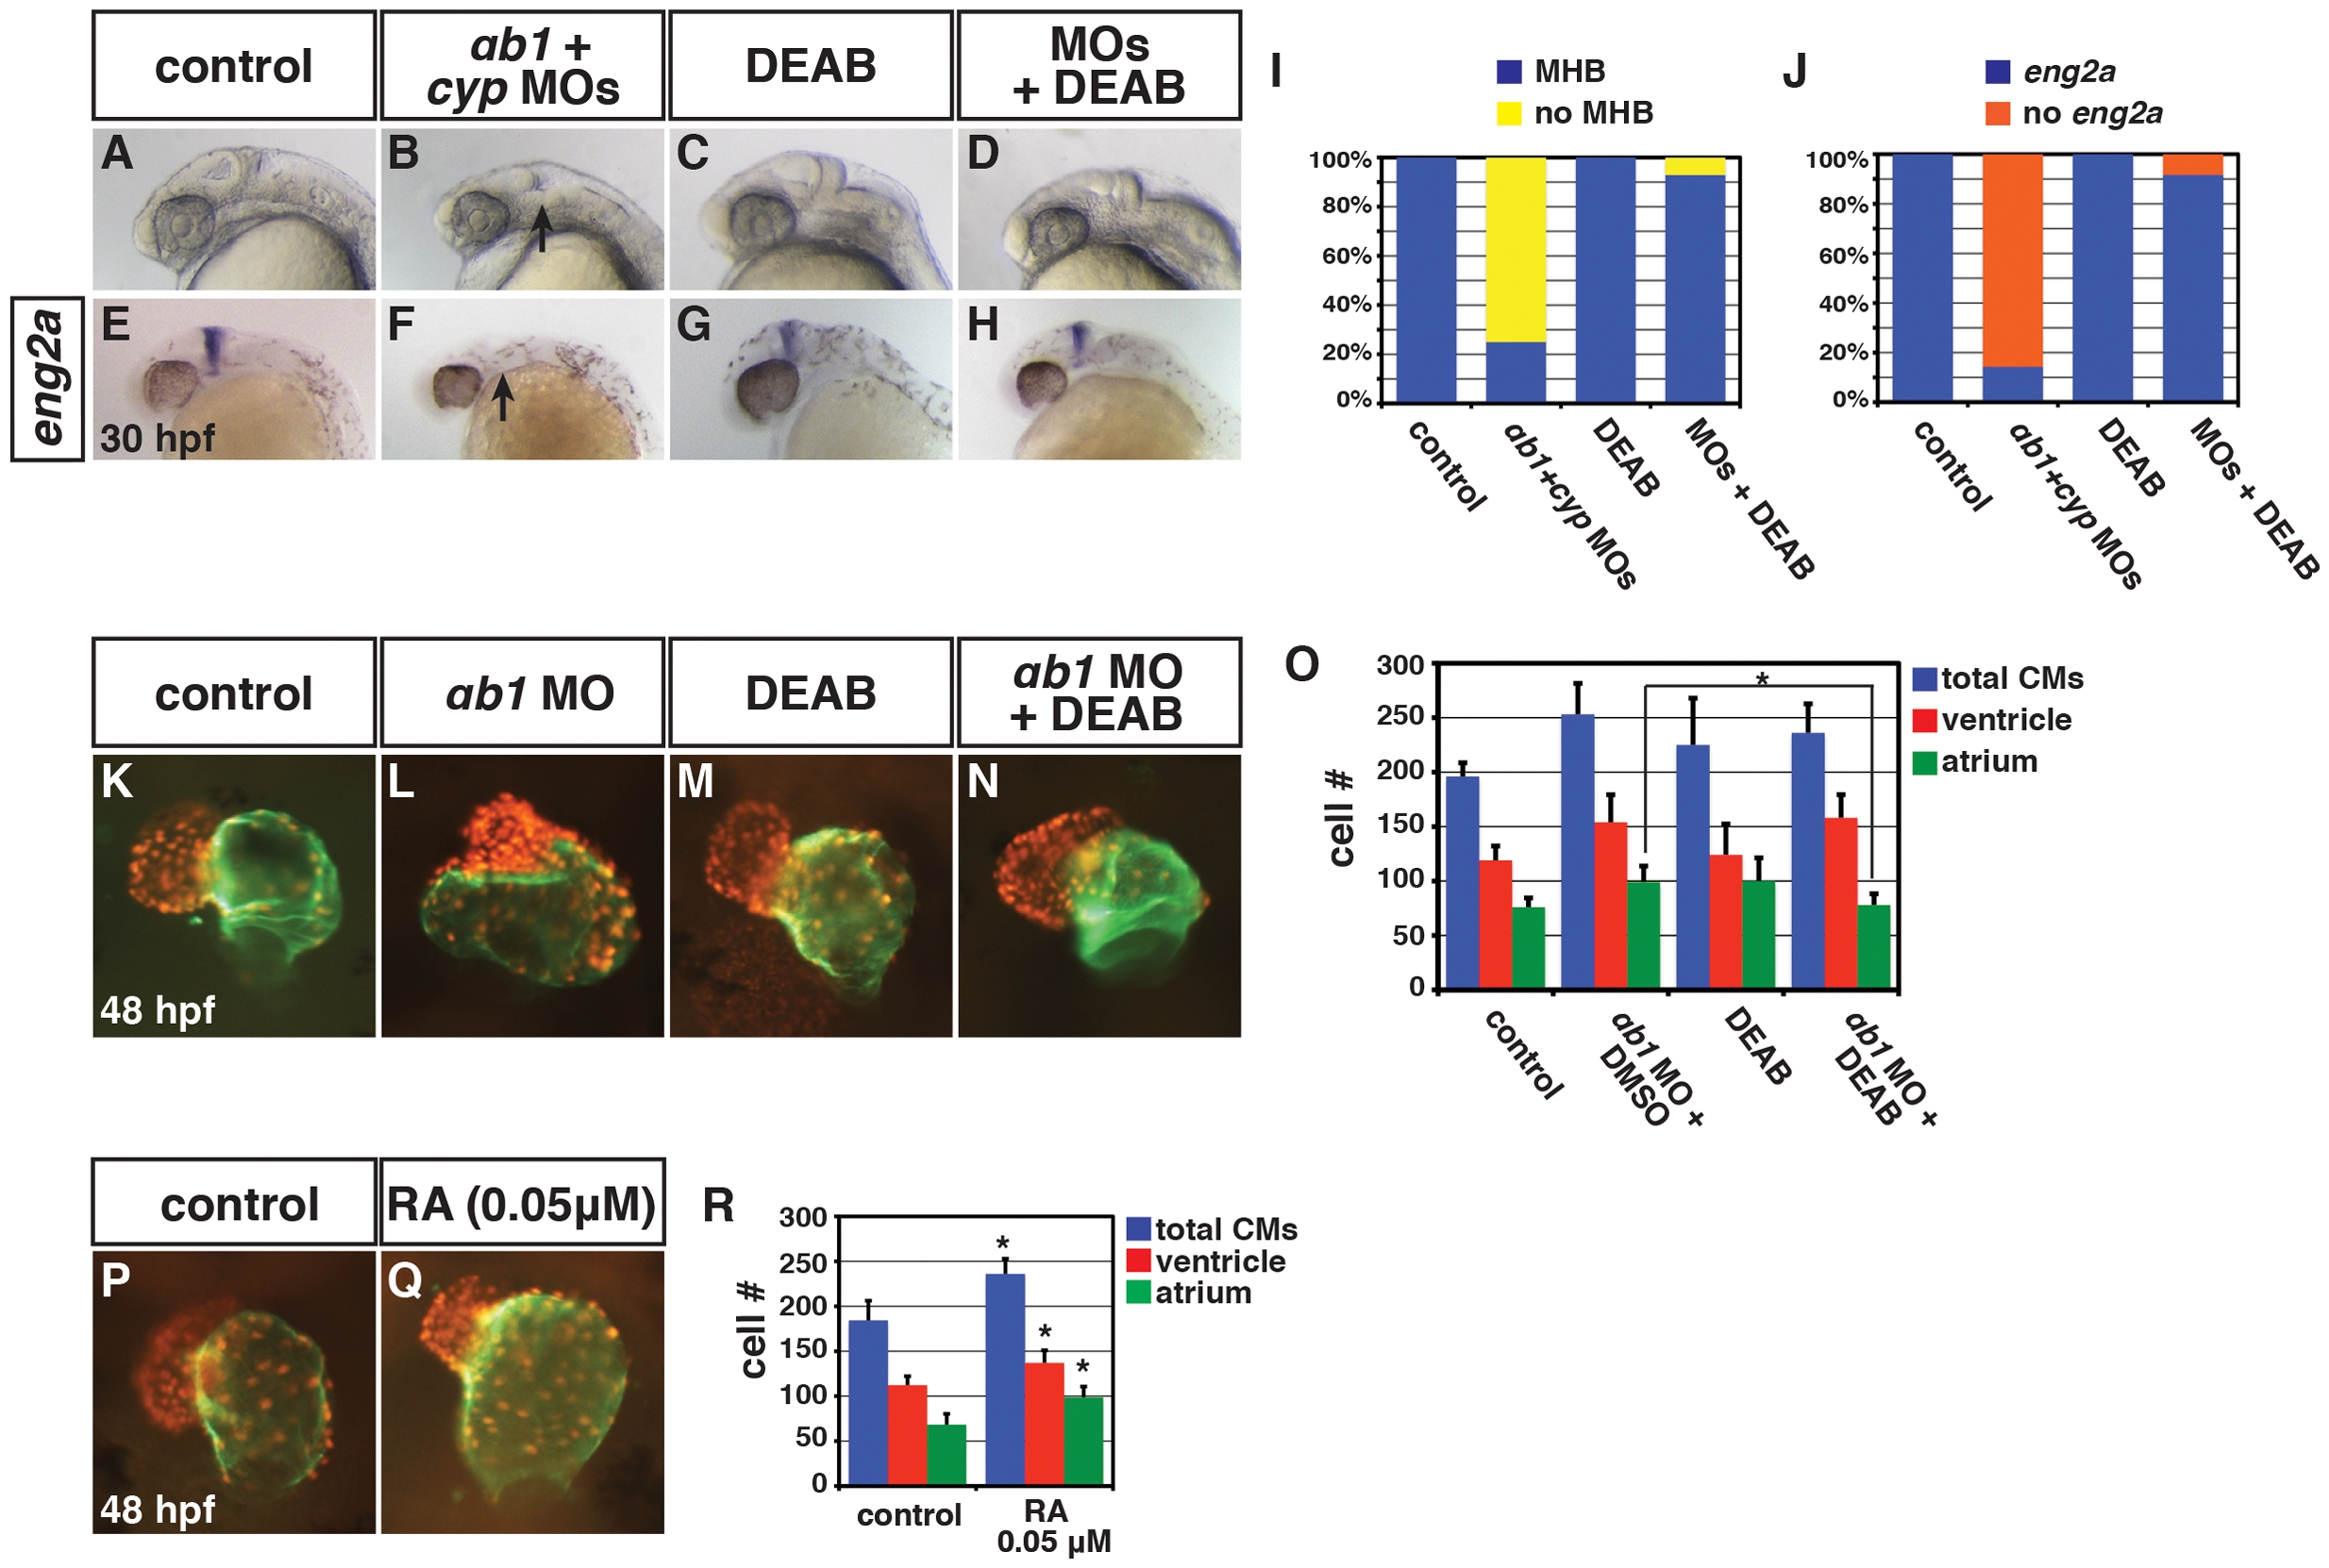
Fig. 6
Reduction of RA in RARαb1 deficient embryos can rescue developmental defects.
(A?H) Control sibling, RARαb1+Cyp26a1 deficient, control sibling treated with DEAB, and RARαb1+Cyp26a1 treated with DEAB embryos. In B and F, arrows indicates loss of the MHB and eng2a expression. Images are lateral views with dorsal right and anterior up. (I) Percentage of control sibling (n = 16), RARαb1+Cyp26a1 deficient embryos (n = 16), control sibling embryos treated with DEAB (n = 13), and RARαb1+Cyp26a1 deficient embryos treated with DEAB (n = 14) that had a MHB based on morphology. (J) Percentage of control sibling (n = 17), RARαb1+Cyp26a1 deficient embryos (n = 14), control sibling embryos treated with DEAB (n = 15), and RARαb1+Cyp26a1 deficient embryos treated with DEAB (n = 12) that had eng2a expression at the MHB. (K?N) Hearts from Tg(-5.1myl7:DsRed-NLS)f2 control sibling, RARαb1 deficient, DEAB treated, and DEAB+RARαb1deficient embryos. Images are frontal views. Red indicates ventricle. Green indicates atrium. (O) Mean CM number at 48 hpf. (P,Q) Hearts from Tg(-5.1myl7:DsRed-NLS)f2 control sibling embryos and Tg(-5.1myl7:DsRed-NLS)f2 embryos treated with a low concentration of RA. Images are frontal views. Red indicates ventricle. Green indicates atrium. (R) Mean CM number at 48 hpf.