- Title
-
Cadherin-11 controls otolith assembly: Evidence for extracellular cadherin activity
- Authors
- Clendenon, S.G., Shah, B., Miller, C.A., Schmeisser, G., Walter, A., Gattone, V.H. 2nd, Barald, K.F., Liu, Q., and Marrs, J.A.
- Source
- Full text @ Dev. Dyn.
|
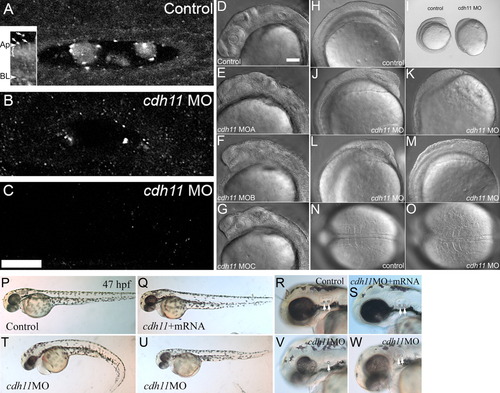
Morpholino oligonucleotide knockdown reduces Cdh11 expression in zebrafish embryos, causing defects in epiboly, gastrulation, and neural development. Zebrafish were injected with control morpholino oligonucleotide (A) or cdh11 splice-site blocking antisense morpholino oligonucleotide (B, C), and these embryos (30 hpf) were processed for whole-mount immunofluorescence using antibodies raised to Cdh11 peptide sequences. Morpholino oligonucleotide knockdown produces a series of hypomorph phenotypes that were categorized as slight (near normal body length, no tail curl, reduced pigmentation, hindbrain defects), moderate (short body length, slight tail curl, small eyes, small otoliths), and severe (very short body length, tail extremely curled, very small eyes, very small or absent otoliths). Small amounts of Cdh11 staining were detected in slightly affected phenotype embryos (B), but no Cdh11 staining above background was detected in moderate (C) and severe (not shown) embryos. A-C have identical orientation, with rostral to the left and lateral toward the top. All are projection images of five optical sections (0.3-mm-thick) through the middle of the otic vesicle. Otoliths were not minimized by choice of plane in knockdown embryos. Laser power, gain settings, filters, and image processing were identical for A-C. Two-photon imaging was performed using Zeiss LSM510 Meta NLO, C-Apochromatic 40× W 1.2NA objective, TRITC-labeled secondary antibody, 800-nm excitation, and mounted in PBS. Scale bar in C = 25 μm, and applies to A-C. Inset shows an image that was processed to highlight abundant Cdh11 labeling in the apical cytoplasm (bracket) of otic epithelial cells. Apical (Ap) and basal (BL) plasma membrane is indicated. Arrows indicate Cdh11 labeled puncta outside the otic epithelial cells, in the otolymph. Specificity of the Cdh11 peptide antibody was validated by competition of the immunoreaction with the immunizing peptide detected by immunoblot and immunofluorescence (see Supp. Fig. S1). Three morpholino oligonucleotides, cdh11MOA,cdh11MOB, and cdh11MOC, described in the Experimental Procedures section, were designed to hybridize with intron-exon splicing border sequences. These morpholino oligonucleotides were tested for effects on Cdh11 expression and their ability to induce aberrant phenotypes. The three morpholino oligonucleotides produced identical phenotypes (compare control [D] with experimental morpholino-injected [E-G]) and with similar efficacy (not shown). DIC and stereomicroscope images of 8-somite control morpholino oligonucleotide-injected embryos (H, I, N) with cdh11 antisense morpholino oligonucleotide-injected embryos at the same developmental age (15 hpf; I-M, O) were compared. Scale bar in D = 100 μm for D-H, J-O. Defects in epiboly were evident: I shows that the embryo proper completely engulfs the large yolk cell in the control embryo, but the embryo proper is only at around 80-90% epiboly in the cdh11 antisense morpholino oligonucleotide-injected embryo shown in I. The phenotype varied in severity and examples are shown in J-M. Dorsal DIC images of the somites are shown in N and O. In the cdh11 antisense morpholino oligonucleotide-injected embryo shown in O, the somites are compressed in the anterior-posterior axis (left to right) and expanded in the medial-lateral axis, indicative of convergence and extension cell movement defects. P-W: Rescue experiment showing that synthetic cdh11 mRNA injection compensates for morpholino-induced defects. P-R: Embryos (47 hpf) injected with control morpholino closely resemble (nearly indistinguishable from) embryos co-injected with cdh11 morpholino oligonucleotide and synthetic cdh11 mRNA (Q-S). Morphant phenotypes produced by injecting cdh11 morpholino oligonucleotide are shown (V,W): curled tail, reduced neural development, smaller eyes, etc. Higher magnification images show reduced inner ear size, reduced otolith size (arrows highlight otoliths; compare R and S with V and W). Also, a Cdh11 morphant embryo (V) had one small and one missing otolith. EXPRESSION / LABELING:
PHENOTYPE:
|
|
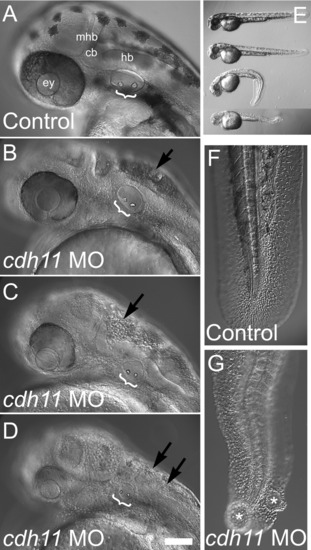
cdh11 loss-of-function neural and tail phenotype. Zebrafish were injected with control morpholino oligonucleotide (A, E, F) or cdh11 antisense morpholino oligonucleotide (B-E, G). Embryos (48 hpf) were imaged using DIC microscopy (A-D, F, G; Nikon diaphot 200, Plan 20× 0.4NA objective using DIC) or a stereo microscope (E; Leica MZ12) using a SPOT Camera (Model 2.2.0 Diagnostic Instruments and Spot software). Increasing severity of cdh11 loss-of-function phenotype is illustrated. B: Slightly affected embryo; C: moderately affected embryo; D: severely affected embryo. Brackets highlight otoliths within the inner ears. Effects on melanocytes, the neural axis, and eye development were also evident. In E, a control-injected embryo is at the top, and the three embryos below are cdh11 morphants with slight, moderate, and severe phenotypes. Higher magnification images of tails (F, G) are shown to illustrate that severely affected cdh11 loss-of-function embryos have significant tail curling, cyst formation (labeled with asterisk in G), and rounded cells indicative of a dysadhesion effect during tail formation. Also, evidence of cellular disorganization and possibly dysadhesion was detected in the brains of all affected cdh11 antisense morpholino oligonucleotide-injected embryos (arrows indicate many rounded, cellular structures fill the fluid space of the hindbrain, fourth ventricle; see B-D). Scale bar in D =100 μm for A-D, F,G. ey, eye; mhb, midbrain-hindbrain boundary; cb, cerebellum; hb, hindbrain. PHENOTYPE:
|
|
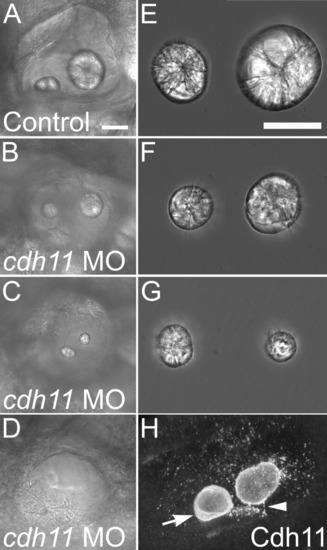
Otolith morphology in Cdh11 knockdown embryos. Zebrafish were injected with control morpholino oligonucleotide (A, E) or cdh11 antisense morpholino oligonucleotide (B-D, F, G), and these embryos (7 dpf) (A-D) and their dissected otolith crystals (E-G) were imaged by DIC microscopy (Nikon diaphot 200: A-D, Plan 20x 0.4 NA objective; E-G, 40x 0.55 NA objective). The otoliths shown in E-G were the same otoliths seen in the inner ears in A-C, respectively. Live embryos mounted in embryo medium (A-D) and otoliths were mounted in PBS. Note that the crystal diffraction patterns are similar, comparing control and morphant otoliths, but the sizes of morphant otolith crystals are reduced (F, G). The more caudal otolith (associated with the posterior macula) was smaller than the more rostral otolith in some morphants (for example, in C and G). Cdh11 immunofluorescence of 3-dpf wholemount-labeled embryos mounted in PBS (H) shows annular patterns in the growing otolith (arrow), and abundant vesicular structures, many associated with the surface of the growing otolith (note: speckle pattern on otolith surface). Two photon microscopy using a BioRad MRC1024, 60x W 1.2 NA, 800-nm illumination, pixel size 0.39 μm, step size 0.4 μm. A projection image of 50 optical sections was made using Voxx Software in alpha blending mode. Arrowhead highlights a linear array of punctate Cdh11 immunolabeling that may represent association with a kinocilium. Scale bar in A = 50 μm for A-D, and the scale bar in E = 50 μm for E-G. For A-D and H, rostral is left, and dorsal is up. Figure was made with Photoshop 6, applying contrast stretch and unsharp mask. EXPRESSION / LABELING:
PHENOTYPE:
|
|
Inner ear epithelial morphology and vesicular structures. BODIPY-ceramide (fluorescent lipid) labeling of living 42-hpf zebrafish embryos and confocal microscopy (A, B) outlines cell surfaces, showing cell shapes of otic epithelial cells. Confocal microscope (Zeiss LSM 510, C-Apochromat 40× W 1.2NA objective, mounted in embryo medium) BODIPY-ceramide fluorescence image planes of a three-dimensional stack are shown (pixels 0.45 μm, z-step 2 μm). The double-layered pseudostratified hair cell (hc) and supporting cell (sc) layers of the sensory patch in control morpholino oligonucleotide-injected embryos (A, indicated by a bracket). The stratification was not detected in cdh11 antisense morpholino oligonucleotide-injected embryos (B), but in these morphant embryos, sensory patches had a thickened appearance (bracket in B). Also, BODIPY-ceramide fluorescence was detected in vesicular structures within the otolymph (arrows in A and B, see also Fig. 5). For A and B, rostral is left, and dorsal is up. Control morpholino oligonucleotide-injected embryo (42 hpf, C) and 42-hpf cdh11 antisense morpholino oligonucleotide-injected embryo (D) were double-labeled using FITC-phalloidin (Molecular Probes) and anti-acetylated tubulin (Sigma) using TRITC-anti mouse secondary antibody (Jackson Labs). We examined several inner ears, and all control and morphant sensory patches had hair cells containing actin-labeled stereocilia and tubulin-labeled kinocilia extending above stereocilia. These are representative images (n=2). Arrows indicate hair cells within the sensory patch. These data also indicate that the kinocilia are present in the cdh11 antisense morpholino oligonucleotide-injected embryo, which are required for attachment of membrane structures subsequent to otolith nucleation (initial attachment of glycogen particles to the kinocilia; Riley et al.,[1997]). Rostral is to the left, and dorsal is up in C and D. Scale bar in A = 50 μm for A-D. Transmission electron microscopy of normal zebrafish otic epithelial cells (E) shows several vesicular structures at their apical surface (asterisk). One vesicular structure that is seen (inset) is quite large and has a multivesicular appearance. Arrows indicate stereocilia of the hair cell bundle. PHENOTYPE:
|
|
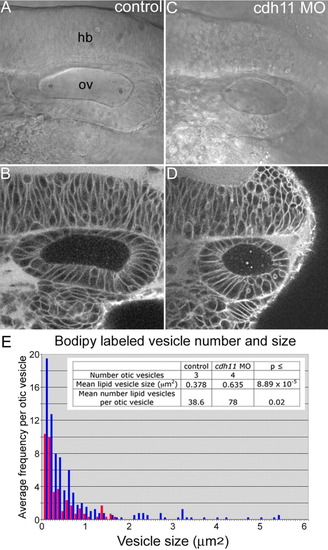
Total number and size of fluorescently labeled vesicular structures increased in Cdh11 knockdown embryos. BODIPY-ceramide labeling of living 20-hpf zebrafish embryos injected with control morpholino oligonucleotide (A, B) and with cdh11 antisense morpholino oligonucleotide-injected embryos (C, D). Transmitted light, DIC microscope images (A, C) and the corresponding confocal optical sections (B, D) are shown, imaged using a Zeiss LSM 510, C-apochromat 63x W 1.2 NA objective, mounted in embryo medium. Single confocal image planes are shown. Fluorescent vesicular structures were quantified using ImageJ software to measure total numbers of vesicular structures and their sizes (for details, see Experimental Procedures section). These numbers were plotted on a frequency distribution graph (E, average frequency of vesicles vs. vesicle size). The table shown as an inset in E lists the number of otic vesicles that were analyzed, the mean lipid vesicle size, and the mean number of lipid vesicles per otic vesicle in control morpholino oligonucleotide-injected (control; red bars) and cdh11 antisense morpholino oligonucleotide-injected (cdh11 MO; blue bars) embryos. Results of the Student′s t-test comparisons of control and cdh11 antisense morpholino oligonucleotide-injected embryo groups were statistically significant. hb, hindbrain; ov, otic vesicle. PHENOTYPE:
|
|
Time lapse imaging of BODIPY-ceramide-labeled vesicular structures suspended within the otolymph and fusing with the otolith. Using the same time-lapse images used to determine size and numbers of vesicular structures within the otolymph of 22-hpf control embryos, movement of individual BODIPY-ceramide-labeled structures was examined. BODIPY-labeled vesicles were seen moving within otic epithelial cells, being exported from otic epithelial apical cell surfaces into the otolymph, moving within the otolymph, and fusing with the growing otolith. Examples of these events are shown in time-lapse sequence. DIC and BODIPY fluorescence images were collected every 2 sec. The first image of each time sequence is shown at the top and proceeds every 2 sec in sequential images from top to bottom. A: Only the BODIPY fluorescence images are shown for this sequence. Arrows on the left side of each panel indicate a BODIPY-ceramide-labeled structure at the lateral cell surface of an otic epithelial cell that moves in a generally apical direction. Arrows on the right side of each panel indicate the apico-lateral region of the cell that appears to generate a BODIPY-labeled punctate vesicle-like structure that enters the otolymph in the final two frames of this sequence. B: DIC and BODIPY fluorescence images were combined into a single image shown in each frame. In B, the dark, unstained structure in the otolymph is the otolith. Single image planes are presented, and the specific image plane within the volume varied over the time sequence to optimize the visualization of the particular BODIPY-labeled puncta highlighted by the arrowheads in each panel. All other image planes were examined to insure that the indicated vesicular structure was not merely moving out of the plane of focus, but appeared to adhere and fuse at the surface of the otolith. Scale bar = 10 μm. |
|
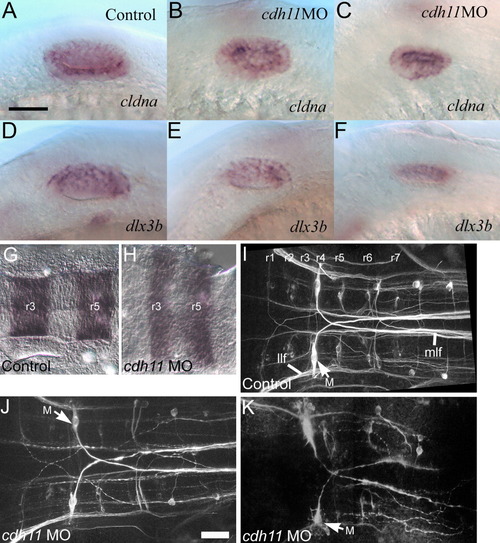
Otic specification, early otic vesicle patterning, and hindbrain phenotype in Cdh11 knockdown embryos. Control morpholino oligonucleotide-injected (A, D) and cdh11 antisense morpholino oligonucleotide-injected 24-hpf embryos (B,C and E,F) were labeled by in situ hybridization with cldna (A-C) and dlx3b (D-F) cRNA probes. Normal expression for cldna (which begins during otic specification and continues in all otic vesicle epithelial cells) was seen in both control and Cdh11 knockdown embryos, although the otic vesicles were smaller in Cdh11 knockdown embryos. Normal expression for dlx3b (which begins during otic specification, continues in the otic vesicle, then resolves into a dorsal pattern in the otic vesicle) was seen in both control and Cdh11 knockdown embryos. Again, otic vesicles were smaller in Cdh11 knockdown embryos. Scale bar in A = 50 μm. In A-F, rostral is left, and dorsal is up. Hindbrain markers were examined in control morpholino oligonucleotide-injected embryos (G, I) and cdh11 antisense morpholino oligonucleotide-injected embryos (H, J, K) using for krox20 in situ hybridization (G, H) or neurofilament immunofluorescence (I-K). In situ hybridization-labeled embryos at 18 hpf were imaged in flat mount using transmitted light DIC microscopy (G, H) using Nikon diaphot 200, 40x DIC 0.55 NA objective. Immunofluorescence of embryos at 48 hpf was imaged in flat mount (I-K) using multiphoton microscopy (BioRad MRC1024, 60x W 1.2 NA objective, 800 nm illumination). Projection images were made using Voxx Software in alpha blending mode. In severe Cdh11 knockdown embryos, lateral longitudinal fasciculus (llf) and medial longitudinal fasciculus (mlf) are severely reduced or absent. However, there is a small labelled fiber tract that might be part of the lateral longitudinal fasciculus, and Mauthner cells (M) axons still contribute to the medial longitudinal fasciculus in severely affected Cdh11 knockdown embryos. Scale bar in J = 50 μm for H-K. In G-K, dorsal images are viewed with rostral at left. Representative images are shown. For all panels, rostral is left, and dorsal is facing the viewer. EXPRESSION / LABELING:
PHENOTYPE:
|
|
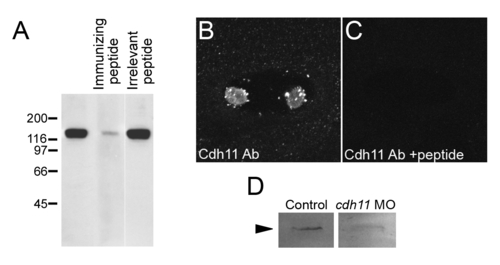
Cdh11 antibody specificity and morpholino-induced expression reduction. A: Immunoblot analysis using anti-Cdh11 rabbit polyclonal antibody (see Experimental Procedures section) to probe adult zebrafish brain homogenate (Cdh11 was abundantly detected in the adult brain) reacted with a single polypeptide (relative migration ∼120 kD; right lane). Immunodetection was reduced by co-incubating the anti-Cdh11 antibody with the immunogen Cdh11 peptide (i.e., used to raise the antibody; middle lane), but immunodetection was not affected by co-incubating the anti-Cdh11 antibody with an identical concentration of an irrelevant peptide (right lane). Immunofluorescence using anti-Cdh11 rabbit polyclonal antibody in wholemount 30-hpf embryos. The typical inner ear Cdh11 expression pattern was detected in control embryos (B), but co-incubating the anti-Cdh11 antibody with the immunogen Cdh11 peptide eliminated all labeling (C). Laser power, gain settings, filters, and image processing were identical for B and C. D: Pools of protein homogenate from three embryos (24 hpf) per lane were immunoblotted to detect Cdh11. This was the smallest number of embryos in which we could reliably detect Cdh11 expression in control embryos (left lane). A pool of three cdh11 morpholino oligonucleotide--injected 24-hpf embryos showed reduced Cdh11 expression levels. A representative result from two experiments is shown. |
|
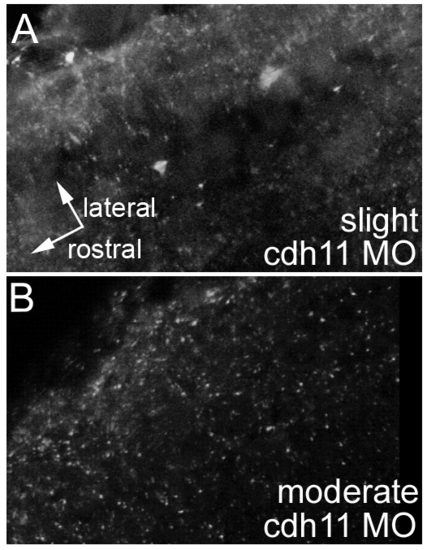
Cdh11 morpholino-induced expression reduction through the entire otic vesicle. To determine whether optical section selection in Figure 1B,C minimized strongly labeled structures (like otoliths), we collected image volumes from the same zebrafish embryos labeled using Cdh11-specific antibodies shown in Figure 1B,C (i.e., injected with cdh11 splice-site blocking antisense morpholino oligonucleotide, as here in A and B). Instead of a projection of 5 optical sections as shown in Figure 1B,C, an image volume was collected through the entire otic vesicle of a slightly affected 30-hpf embryo (A; 45 optical sections, 0.3 μm z-step) and a moderately affected 30-hpf embryo (B; 25 optical sections, 0.3 μm z-step). Projection images were made in alpha blending mode using Voxx software. Adobe Photoshop 6 was used to prepare the figure. The otic vesicle was smaller in the moderately affected embryo, but both images (A and B) are projections of image volumes through the entire inner ear region of the embryos. A and B have identical orientation, with rostral and lateral as shown in A. These image volumes illustrate that only small amounts of Cdh11 labeling were detected in slightly affected phenotype embryos (A), and little or no Cdh11 labeling was detected above background in moderately affected (in B, background from 25 optical sections is combined) and severely affected (not shown) embryos. Laser power, gain settings, filters, and image processing were identical for A and B. Two-photon imaging was performed using Zeiss LSM510 Meta NLO, C-Apochromatic 40xW 1.2NA objective, TRITC-labeled secondary antibody, 800-nm excitation, and mounted in PBS. |
|
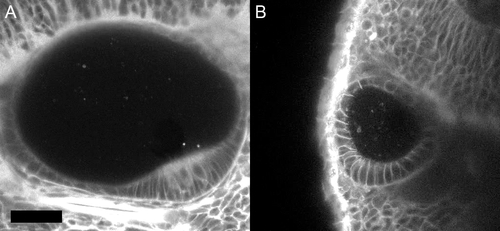
BODIPY-ceramide-labeled vesicular structures in control and Cdh11 knockdown 42-hpf embryos. BODIPY-ceramide-labeled living 42-hpf zebrafish embryos injected with control morpholino oligonucleotide (A) and with cdh11 antisense morpholino oligonucleotide (B). Confocal optical sections are shown, using a Zeiss LSM 510, C-apochromat 63x W 1.2 NA objective, mounted in embryo medium. Representative confocal image planes are shown. Due to technical difficulties described in the text, quantification would not be as reliable at this developmental stage. However, there was an apparent increase in the number and size of BODIPY-labeled puncta in Cdh11 knockdown embryos. Scale bar = 30 μm. |

