- Title
-
Dopaminergic neuronal cluster size is determined during early forebrain patterning
- Authors
- Russek-Blum, N., Gutnick, A., Nabel-Rosen, H., Blechman, J., Staudt, N., Dorsky, R.I., Houart, C., and Levkowitz, G.
- Source
- Full text @ Development
|
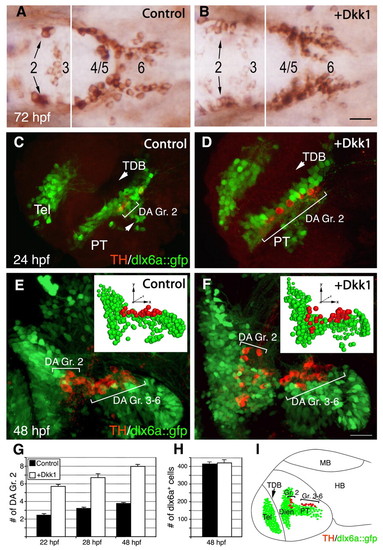
The Wnt antagonist Dkk1 causes an increase in DA cell number. (A,B) Dorsal views of zebrafish embryos injected with (A) vehicle solution or (B) an in vitro synthesized capped mRNA encoding Dkk1. Embryos were fixed at 72 hours post-fertilization (hpf) and subjected to immunostaining with an anti-tyrosine hydroxylase (TH) antibody to detect dopaminergic (DA) neurons. Diencephalic DA groups [as annotated by Rink and Wullimann (Rink and Wullimann, 2002)] are marked. (C-F) Projected confocal z-stack images of DA neurons (red) in transgenic embryos expressing GFP under the control of the dlx6a promoter (dlx6a::gfp; lateral view). Embryos were injected with either a vehicle solution (C,E) or dkk1 mRNA (D,F), and were fixed at either 24 (C,D) or 48 (E,F) hpf. The insets in E and F show bubble-plot graphic representations of the x, y, z cell position of all dlx6a+ (green) and TH+ (red) cells in the ventral diencephalon. Bubble size was derived from the position of the cells along the z-axis to give the impression of depth. The positions of DA group 2 (Gr. 2) and groups 3-6 (Gr. 3-6) are indicated. (G) Bar chart showing average counts of dopamine transporter (Dat)-expressing DA group 2 (Gr. 2) cells in WT (control) and dkk1-injected embryos. Dat+ neurons were detected by whole-mount in situ hybridization with dat probe at 22, 28 and 48 hours post-injection (n=25). (H) Bar chart showing average counts of dlx6a+ cells in the basal diencephalon of WT and dkk1-injected dlx6a::gfp transgenic embryos (n=5). (I) Schematic depicting the major diencephalic DA cell groups that appear in the developing embryo at 48 hpf, relative to the dlx6a::gfp expression domain. Dien, diencephalon; HB, hindbrain; MB, midbrain; PT, posterior tuberculum; Tel, telencephalon; TDB, telencephalic-diencephalic boundary. Scale bars: 25 μm. EXPRESSION / LABELING:
PHENOTYPE:
|
|
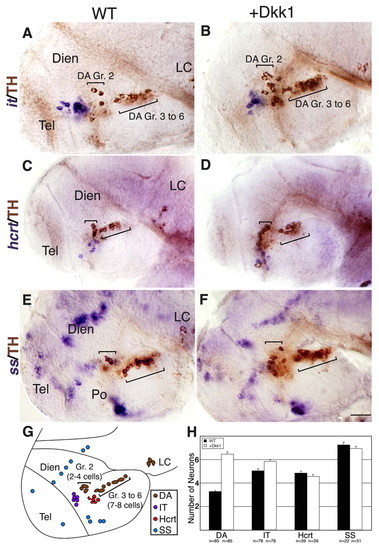
Dkk1 selectively affects DA cell number, but not neighboring basal diencephalic neurons. (A-F) Lateral views of either WT zebrafish embryos (A,C,E) or their dkk1 mRNA-injected siblings (B,D,F). Embryos were fixed at 48 hpf and subjected to whole-mount in situ hybridization with RNA probes directed against the hypothalamic neuropeptide isotocin (zebrafish ortholog of oxytocin) (it; A,B), hypocretin (hcrt; C,D) or somatostatin (ss; E,F). All specimens were then subjected to immunostaining with an anti-tyrosine hydroxylase (TH) antibody to detect DA neurons. (G) Schematic representation of the examined diencephalic cell types in a 48-hpf WT embryo. The positions of DA group 2 (Gr. 2) and groups 3-6 (Gr. 3 to 6) are indicated. (H) Bar chart presenting average counts of dat-expressing DA group 2 cells (DA), isotocin (IT), hypocretin/orexin (Hcrt) or somatostatin (SS) expressing cells in WT and dkk1-injected embryos at 48 hpf. The number of embryos analyzed (n) is shown below. Dien, diencephalon; LC, locus coeruleus; Po, preoptic area; Tel, telencephalon. Scale bar: 50 μm. |
|
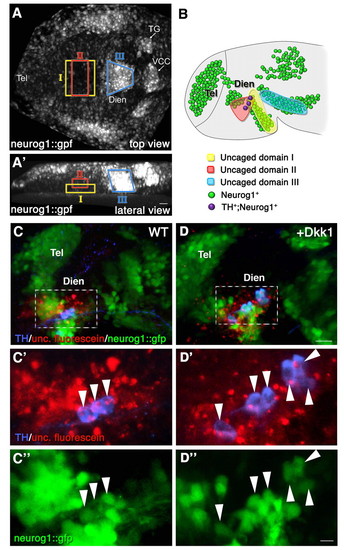
Fate mapping of the diencephalic progenitor zones. High-resolution fate mapping by two-photon-based uncaging procedure. (A,A') Zebrafish embryos (anterior to the left) expressing GFP under the control of the neurog1 promoter (neurog1::gfp) were injected with caged dextran-fluorescein tracer dye at the 1-cell stage. At the 1- to 3-somite stage, the dye was uncaged at the indicated domains (denoted I, II and III) of the diencephalic anlage. (A) Dorsal view; (A′) lateral view. (B) Schematic summarizing the results of multiple uncaging experiments showing the final destination of the fluorescein-labeled cells in 24-hpf neurog1::gfp embryos. The clones corresponding to each of the uncaged domains are color coded (I, n=6; II, n=6; III, n=10). (C-D″) Control (WT; C-C″) and dkk1 mRNA-injected (D-D″) embryos that underwent uncaging were fixed at 24 hpf, followed by immunofluorescence staining of the uncaged fluorescein and of TH+ DA neurons. High-magnification images of a diencephalic area (dashed boxes in C,D) containing neurog1+ TH+ fluorescein+ triple-positive cells (arrowheads) are shown in C′,C″,D′,D″. Dien, diencephalon; Tel, telencephalon; TG, trigeminal ganglion; VCC, ventrocaudal cluster. Scale bars: 25 μm in A-D; 50 μm in C′,C″,D′,D″. |
|
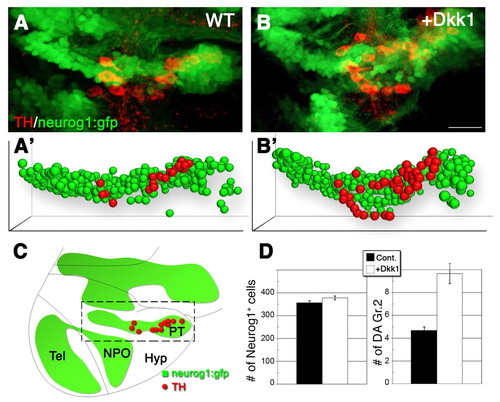
Specific neurog1+ precursor pools differentially respond to Wnt signaling. (A,B) Projected confocal z-stack images (lateral view) of DA (red) and neurog1+ (green) cells in neurog1::gfp transgenic zebrafish reporter embryos. Embryos were injected with either a vehicle solution (A) or an mRNA encoding Dkk1 (B). (A′,B′) Bubble-plot graphic representation of the x, y, z cell position of all neurog1+ (green) and DA (TH+ neurog1+) cells (red) in the PT. Bubble size was derived from the position of the cells along the z-axis to give the impression of depth. (C) Schematic depicting the major diencephalic DA cell groups in the developing embryo at 48 hpf, relative to the neurog1::gfp expression domains. The area indicated by the dashed box corresponds to the posterior tuberculum domain as shown at high-magnification in A,B. (D) Bar charts showing the averaged number of neurog1+ and DA (TH+ neurog1+) cells in embryos that were injected with either a vehicle solution or dkk1 mRNA (n=5). Hyp, hypothalamus; NPO, neurosecretory preoptic nucleus; PT, posterior tuberculum; Tel, telencephalon. Scale bar: 25 μm. |
|
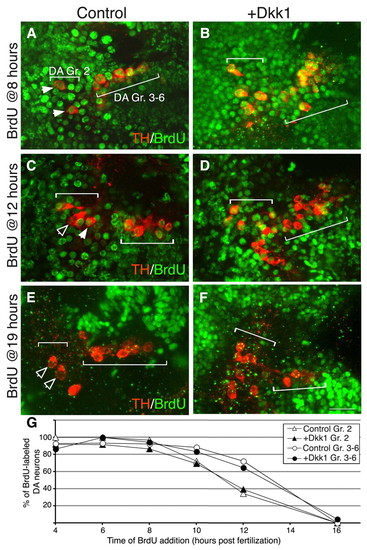
Dkk1 does not delay cell cycle exit. (A-F) Projected confocal z-stack images of wild-type (WT; A,C,E) and dkk1- injected (B,D,F) zebrafish embryos at 48 hpf. Proliferating DA progenitors were labeled by BrdU at the indicated time points followed by immunofluorescence staining with antibodies against tyrosine hydroxylase (TH) and BrdU. The positions of DA group 2 (Gr. 2) and groups 3-6 (Gr. 3-6) are indicated. Solid arrowheads indicate TH+ BrdU+ double-positive neurons; open arrowheads indicate TH+ neurons with no nuclear BrdU staining. (G) Plot of the percentage of proliferating group 2 (Gr. 2; triangles) and group 3-6 (Gr. 3-6; circles) DA progenitor cells as a function of time in WT (white symbols) and dkk1-injected (black symbols) populations. Scale bar: 25 μm. |
|
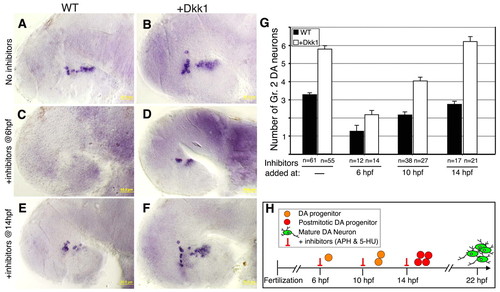
Temporal inhibition of DA progenitor proliferation. (A-F) Lateral views of Dat+ DA neurons in zebrafish embryos injected with vehicle (WT; A,C,E) or dkk1 mRNA (B,D,F). At the indicated time points, embryos were treated with (A,B) solvent (4% DMSO) or with (C-F) a cell cycle inhibitor cocktail containing aphidicolin (APH, 1 μg/ml) and 5-hydroxyurea (5-HU, 50 mM). DA neurons were counted at 48 hpf. (G) Bar chart showing average cell counts of Dat-expressing DA group 2 (Gr. 2) neurons in wild-type and dkk1-injected embryos. The number of embryos analyzed (n) is shown beneath. (H) Schematic representation of DA progenitor proliferation, deduced from the analysis of DA cell number following temporal inhibition of cell division. Scale bars: 50 μm. |
|
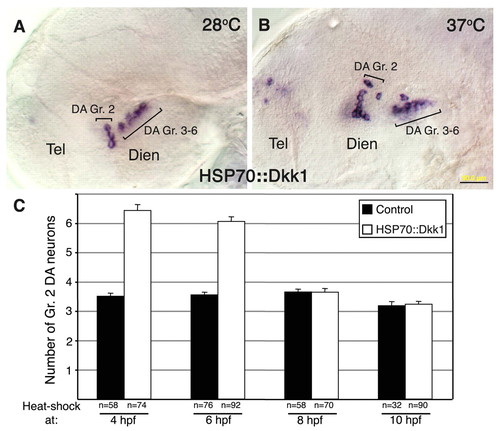
Wnt attenuation modulates DA cell number at late gastrula stage. (A,B) Micrographs of DA neurons in 48-hpf zebrafish embryos that were injected with a Tol2 vector harboring dkk1 cDNA under the control of the heat-shock 70 promoter (hsp70::dkk1). (A) Embryos were incubated at the non-permissive temperature of 28.5°C for 48 hours. (B) Embryos were incubated at 28.5°C until 4 hpf and were then shifted to 37°C for 1 hour and thereafter grown at 28.5°C. Embryos were subjected (after 48 hours at 28.5°C) to in situ hybridization with a dat RNA probe. (C) Bar chart showing average cell counts of DA neurons in control and hsp70::dkk1-injected embryos. All embryos were subjected to a 1-hour temperature shock (37°C) at the indicated stages of development, as described above. The number of embryos analyzed (n) is shown beneath. Dien, diencephalon; Tel, telencephalon. Scale bar: 50 μm. |
|
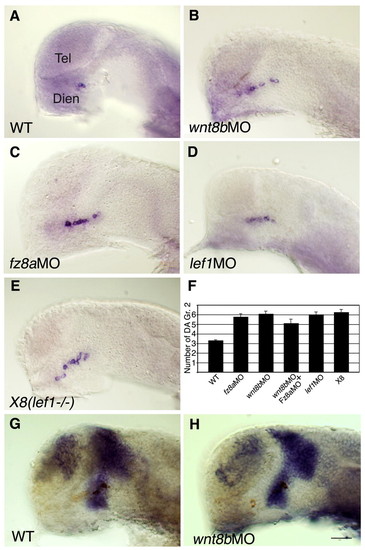
Canonical Wnt pathway components restrict DA cell number. (A-E) Lateral views of zebrafish embryos that were injected with vehicle solution (WT, n=71; A), wnt8b morpholino (MO) (n=20; B), fz8a MO (n=11; C) or lef1 MO (n=18; D) and of the lef1-deficient X8 deletion mutant (n=18; E). Embryos were fixed at 24 hpf and subjected to in situ hybridization with a dat probe. The result of the double knockdown of wnt8b and fz8a (n=44) is presented in F. (F) Bar chart summarizing average cell counts of DA group 2 neurons in the genetic backgrounds shown in A-E. (G,H) Lateral views (anterior to the left) of embryos that were injected with vehicle solution (G) or wnt8b MO (H). Embryos were fixed at 24 hpf and subjected to whole-mount in situ hybridization with an RNA probe directed against barhl2. Scale bar: 50 μm. |
|
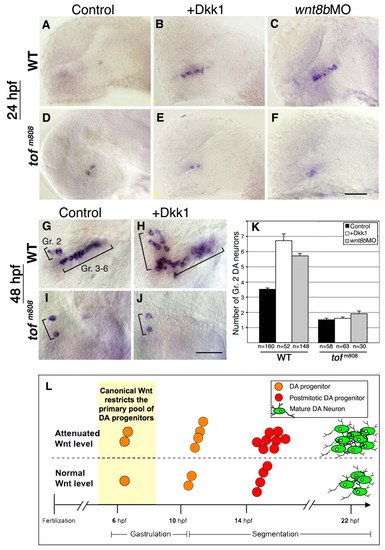
fezl acts downstream of Wnt in controlling DA cell number. (A-F) Lateral views of wild-type zebrafish embryos (WT; A-C) and too few mutant embryos (tofm808; D-F), which harbor a hypomorphic allele of the fezl gene (anterior to the left). Embryos were injected with vehicle solution (control; A,D), dkk1 mRNA (B,E) or antisense wnt8b MO (wnt8bMO; C,F). Embryos were fixed at 24 hpf and subjected to in situ hybridization with a dat probe. (G-J) Lateral views of wild-type (G,H) and tofm808 (I,J) embryos. Embryos were injected with vehicle solution (G,I) or dkk1 mRNA (H,J). Embryos were fixed at 48 hpf and subjected to whole-mount in situ hybridization with a dat probe. The positions of DA group 2 (Gr. 2) and groups 3-6 (Gr. 3-6) are indicated. (K) Bar chart presenting average counts of Dat+ DA group 2 (Gr. 2) cells in WT and tofm808 embryos that were injected with vehicle solution, dkk1 mRNA or wnt8b MO. The number of embryos analyzed (n) is shown beneath. (L) Proposed mechanism for the control of DA cell number by canonical Wnt signaling. Under normal conditions, early canonical Wnt signals restrict the primary pool of progenitors to a single cell that undergoes two cell divisions before differentiating into DA group 2 neurons. Early attenuation of the Wnt signaling pathway relieves this restriction, allowing two progenitors to divide twice and to differentiate into a significantly larger population of DA neurons. Scale bars: 20 μm. |
|
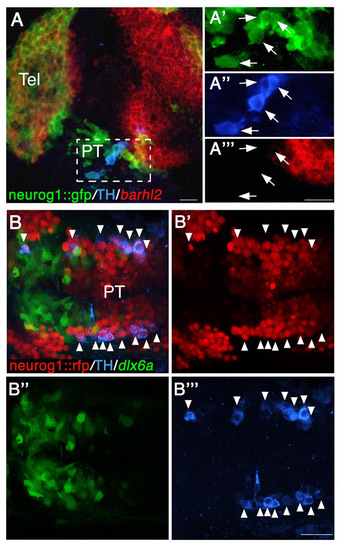
All TH-positive DA neurons express neurog1 in the diencephalon. (A-A′″) Lateral view of neurog1::gfp transgenic reporter embryo (at 24 hpf), which was subjected to in situ hybridization with an antisense barhl2 probe followed by double immunofluorescence staining with antibodies against TH and GFP (A). High-magnification images of cells expressing neurog1, TH and barhl2 are shown in A′-A′″, respectively. Arrows indicate neurog1+ TH+ double-positive cells. (B-B′″) Dorsal view of double-transgenic neurog1::nRFP; dlx6a::GFP embryo (at 48 hpf), which was subjected to immunofluorescence staining with antibodies against TH (B). Arrowheads indicate neurog1+ TH+ double-positive neurons. Single-channel fluorescent images are presented in B′-B′″. PT, posterior tuberculum; RFP, red fluorescent protein; Tel, telencephalon. Scale bars: 20 μm. |
|
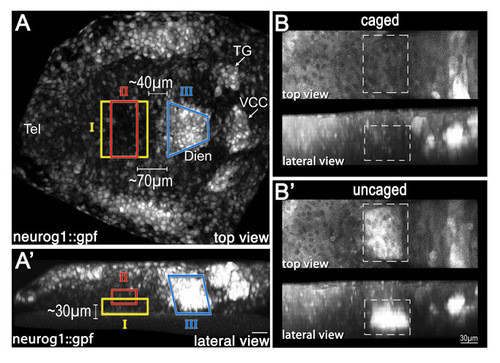
Positioning of diencephalic progenitor zones in the neural plate determined by the two-photon-based uncaging method. (A,A′) Embryos (anterior to the left) expressing GFP under the control of the neurog1 promoter (neurog1::gfp) were injected with caged dextran-fluorescein tracer dye at the 1-cell stage. At the 1- to 3-somite stage, the dye was uncaged at discrete domains (denoted I, II and III) of the diencephalic anlage. (A) Dorsal view; (A′) lateral view. (B,B′) Projected two-photon z-stack (anterior to the left) of transgenic neurog1::gfp embryo injected with caged fluorescein-dextran (B). The uncaging of the fluorescein tracer at a specific region of interest (dashed box) is visualized in B′. Dien, diencephalon; Tel, telencephalon; TG, trigeminal ganglion; VCC, ventrocaudal cluster. |
|
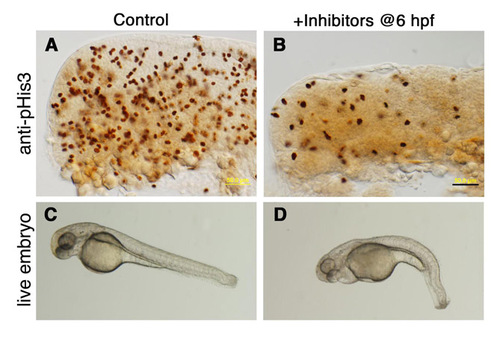
The effect of cell division inhibitors on embryonic development. (A-D) Control embryos were incubated (A,C) in 4% DMSO or (B,D) in a solution containing the cell division inhibitors aphidicolin (APH, 1 μg/ml) and 5-hydroxyurea (5-HU, 50 mM) dissolved in 4% DMSO. Treatment was initiated at 6 hpf, and embryos were cultured overnight until 24 hpf. Lateral views of WT embryos immunostained for phospho-histone H3 (A,B) and of live embryos (C,D) demonstrating that embryogenesis proceeds relatively normally in the presence of cell division inhibitors. Scale bar: 50 μm. |
|
Wnt attenuation does not affect the barhl2 diencephalic expression domain. Lateral views (anterior to the left) of wild-type (A), lef1 MO-injected (B) or X8 deletion mutant (C) embryos. Embryos were fixed at 24 hpf and subjected to whole-mount in situ hybridization with antisense RNA probe directed against barhl2. All specimens were then subjected to immunostaining with an anti-tyrosine hydroxylase (TH) antibody to detect DA neurons. Scale bar: 50 μm. |

