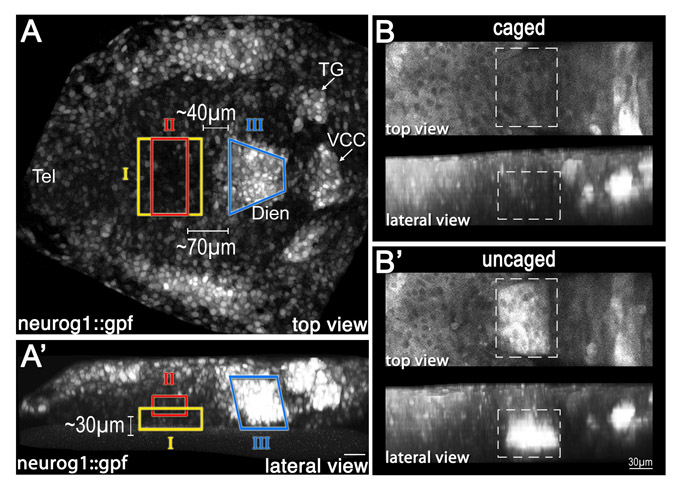
Fig. S3 Positioning of diencephalic progenitor zones in the neural plate determined by the two-photon-based uncaging method. (A,A′) Embryos (anterior to the left) expressing GFP under the control of the neurog1 promoter (neurog1::gfp) were injected with caged dextran-fluorescein tracer dye at the 1-cell stage. At the 1- to 3-somite stage, the dye was uncaged at discrete domains (denoted I, II and III) of the diencephalic anlage. (A) Dorsal view; (A′) lateral view. (B,B′) Projected two-photon z-stack (anterior to the left) of transgenic neurog1::gfp embryo injected with caged fluorescein-dextran (B). The uncaging of the fluorescein tracer at a specific region of interest (dashed box) is visualized in B′. Dien, diencephalon; Tel, telencephalon; TG, trigeminal ganglion; VCC, ventrocaudal cluster.
Image
Figure Caption
Acknowledgments
This image is the copyrighted work of the attributed author or publisher, and
ZFIN has permission only to display this image to its users.
Additional permissions should be obtained from the applicable author or publisher of the image.
Full text @ Development

