Fig. 6
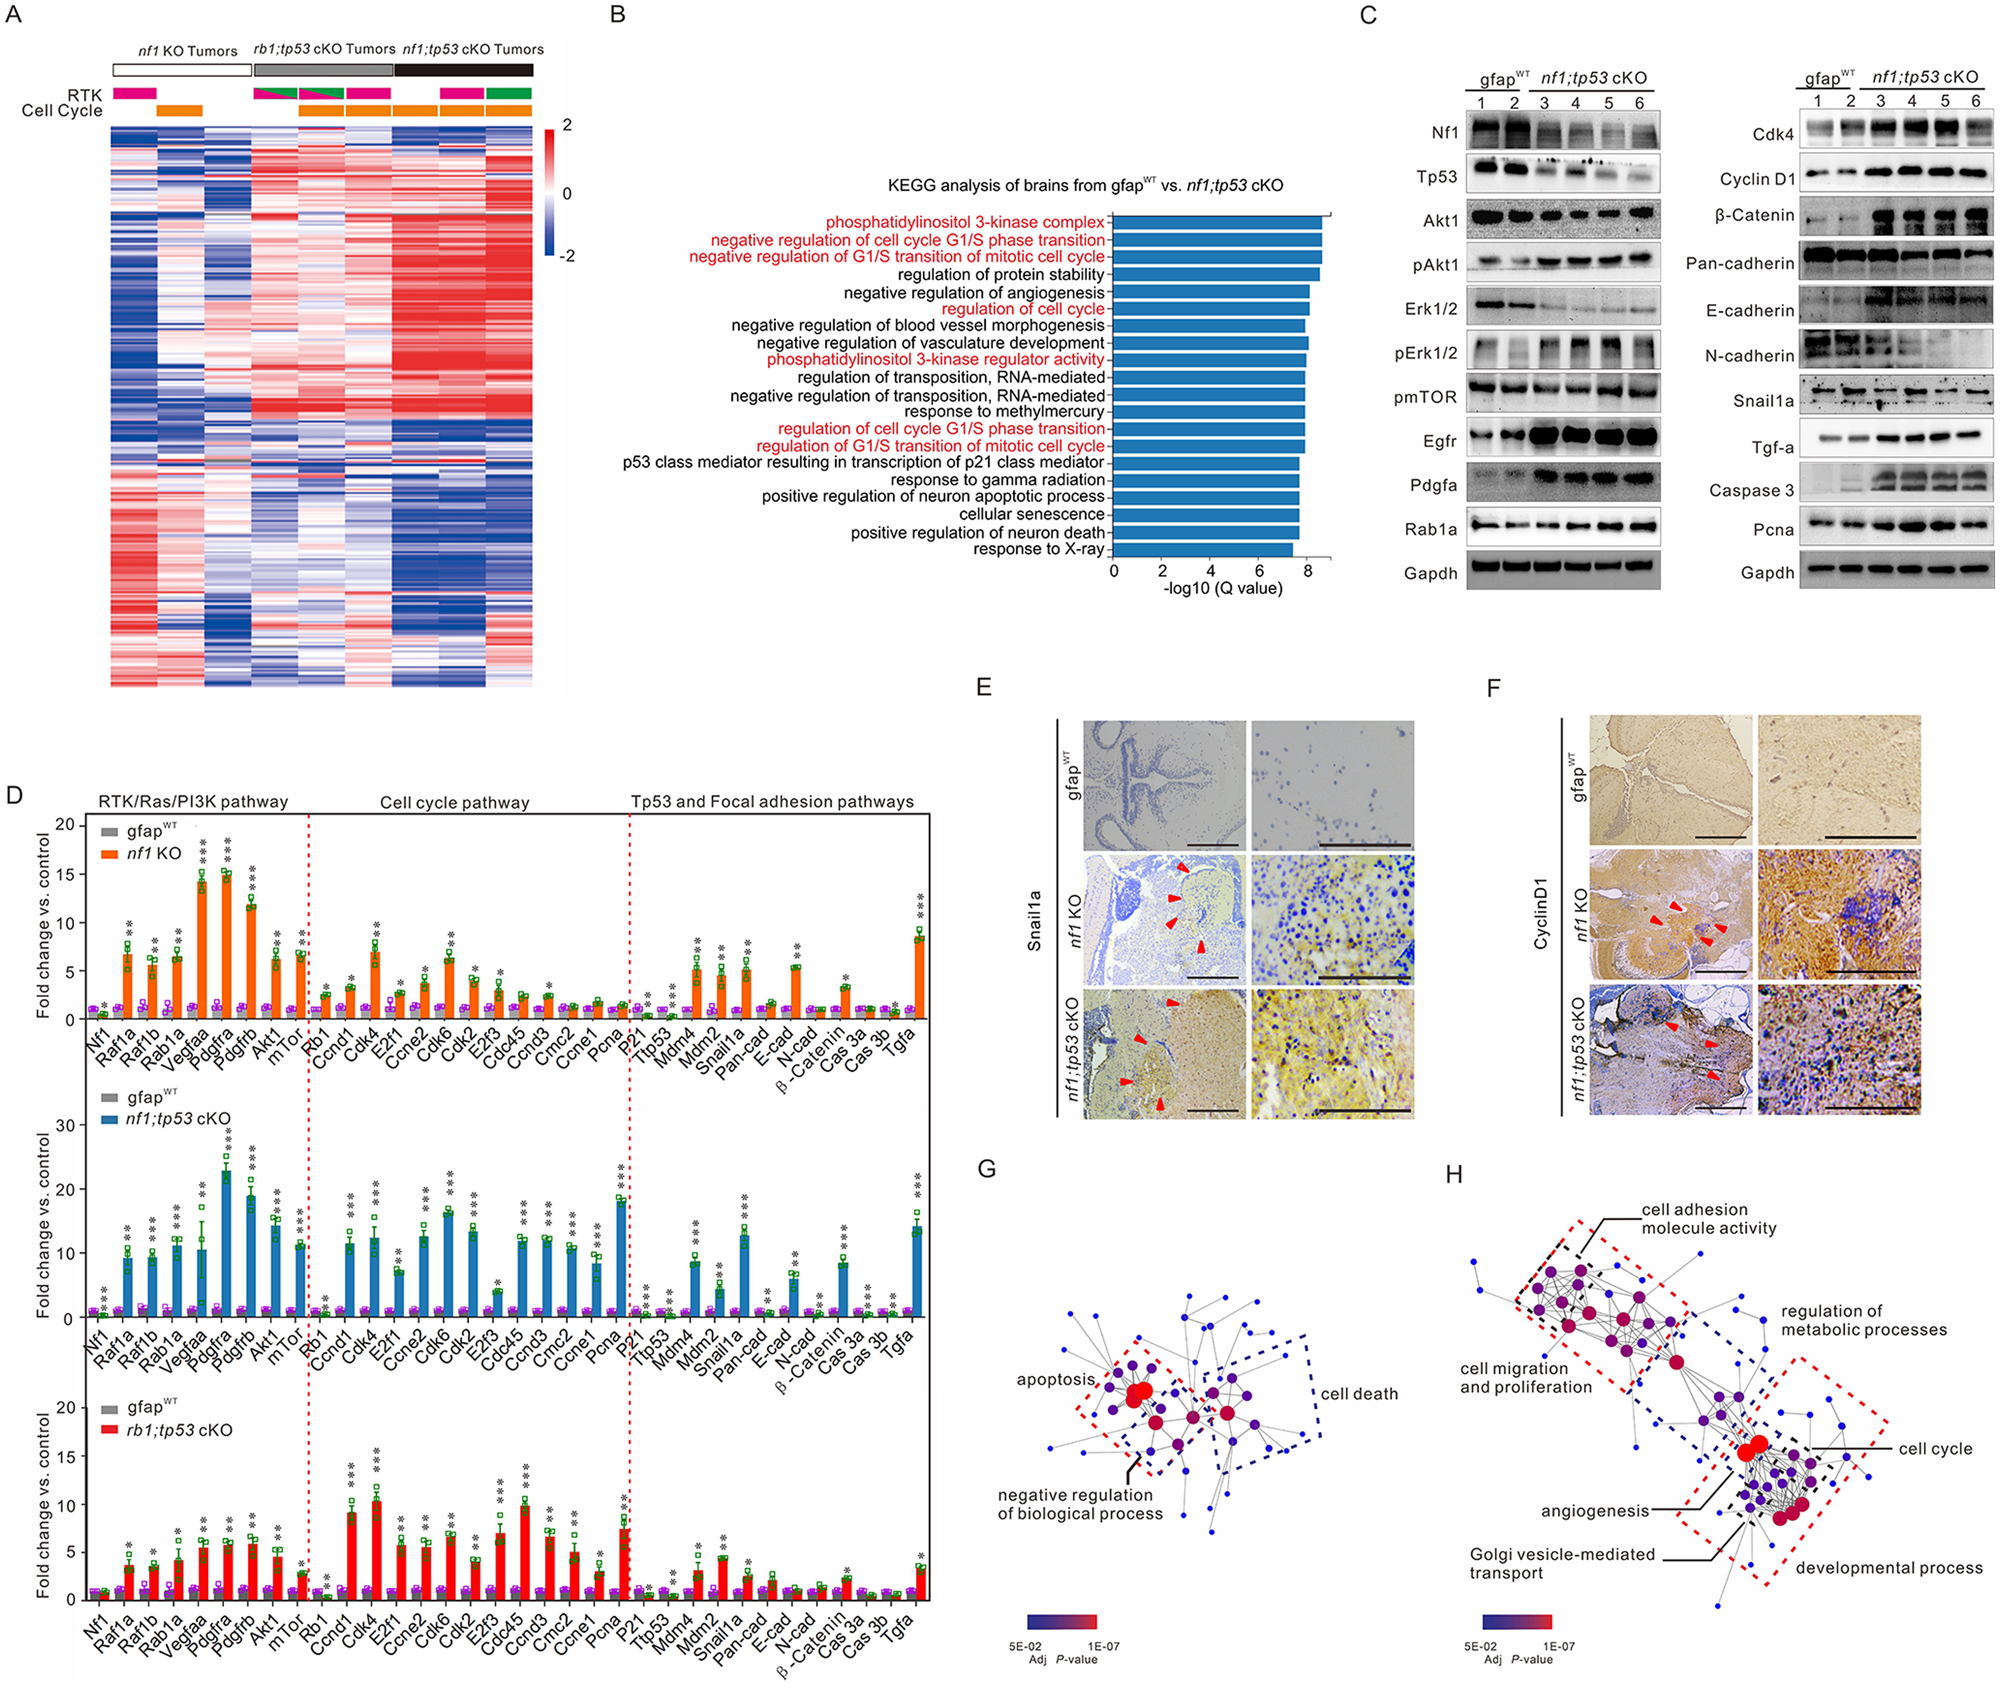
Fig. 6 Identification of downstream signalling pathways in tumours generated in zebrafish with various mutations. (A) Heat map of differential expression genes based on the ratios identified the fold-changes indicating gains (red) and losses (blue) in the randomly selected brain tissues with glioma formation derived from 3-month-old nf1 cKO (white bar), rb1;tp53 cKO (grey bar), and nf1;tp53 cKO (black bar) fish (n?=?3 for each group). The amplifications of genes encoding RTKs Egfr (pink bars) and Pdgfra (green bars), as well as the amplification of cell cycle-related genes (Supplementary Table 6, orange bars) were also indicated. (B) KEGG pathway enrichment analyses of the tumours generated in nf1;tp53 cKO fish. (C) Western blot determinations were performed to confirm the expression of the key gliomagenesis-related factors in gfapWT (lanes 1?2) and nf1;tp53 cKO tumours (lanes 3?6). (D) Relative expression of key factors of RTK/Ras/PI3K, cell cycle, and focal adhesion pathways in nf1 KO, rb1;tp53 cKO and nf1;tp53 cKO fish, compared with gfapWT control (n?=?3 for each group). (E and F) Gliomas associated with nf1 and tp53 mutations showed stronger expression of Snail1a (E) and cyclin D1 (F), particularly in the hypercellular area (arrowheads). Scale bars = 100 ?m. (G and H) Network visualization of GO terms associated with the downregulated (G) and upregulated genes (H) in brain tissues between nf1;tp53 cKO and gfapWT control.

