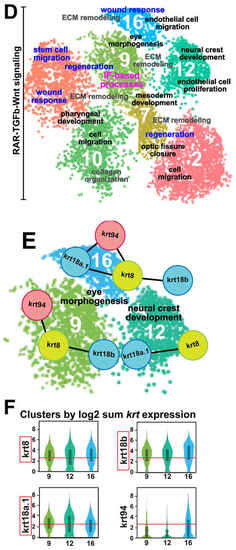
Keratin intermediate filament genes are expressed during early ocular development. (A) Step 1: Live images (lateral views) of the heads of 48-hpf Tg(-4.7sox10::EGFP) and Tg(foxd3::GFP) embryos for the collection of distinct sox10 (left panel) and foxd3 (right panel) POM neural crest cell subpopulations by FACS to isolate the GFP+ cells. Step 2: Following quality checks, the samples were loaded onto the 10× Genomics Chromium platform for the partitioning and encapsulation of single cells into nanoliter-sized GEMs (Gel beads-in-EMulsion). Each encapsulated cell was then lysed within its GEM, and the released RNA was reverse transcribed to cDNA with primers attached to a gel bead carrying a unique 10× barcode for downstream cell separation. Subsequently, the GEMs were broken, and all uniquely barcoded cDNAs were pooled, followed by PCR to generate enough material. Step 3: Illumina sequencing and library construction were performed using the 10× Genomics Single Cell 3′ v3.1 Protocol. Raw sequencing data were demultiplexed and the FASTQ files were aligned to the zebrafish reference genome (danRer11) using Cell Ranger. Loupe Browser (version 7.0.1) was used to evaluate the data and for further downstream analysis. (B) Cluster distribution at 48 hpf. Sox10:GFP and foxd3:GFP periocular neural crest cell subpopulations primarily clustered together, with few non-overlapping sox10+ and foxd3+ clusters (left panel). In total, 21 functional subgroups were observed in the combined dataset (right panel). (C) Cell type analysis based on the high expression of periocular mesenchyme (POM) transcription factors previously implicated in regulating ocular neural crest cell migration and differentiation (eya2, foxc1a, foxc1b, foxo1a, lmx1ba, lmx1bb, pitx2, tfap2a, and tfap2b), revealed 7 functional subgroups of interest. (D) Pathway enrichment analysis (Metascape) identified common and distinct putative biological functions (black and gray font) represented by the genes in the 7 functional subgroups of interest. In addition, healing and repair processes (blue font) were also highlighted amongst these functional subgroups. Moreover, the functional subgroup (Cluster 9) associated with ‘eye morphogenesis’, ‘ECM remodeling’, and ‘regeneration’ was also related to ‘intermediate filament (IF)-based processes’ (magenta font). (E) STRING analysis identified intermediate filament gene networks comprising krt94, krt8, krt18a.1, and krt18b among clusters associated with ‘eye morphogenesis’ and ‘neural crest development’ (Clusters 9, 12, 16). (F) Intermediate filament binding partners krt8 and krt18a.1/18b showed marked upregulated expression (at least 2.5x, as indicated by the red lines) during anterior segment development.
|
