
Figure 9
- ID
- ZDB-FIG-210725-95
- Publication
- Ma et al., 2021 - Matriptase activation of Gq drives epithelial disruption and inflammation via RSK and DUOX
- Other Figures
-
- Figure 1
- Figure 1—figure supplement 1.
- Figure 2
- Figure 2—figure supplement 1.
- Figure 3
- Figure 3—figure supplement 1.
- Figure 4
- Figure 4—figure supplement 1.
- Figure 5.
- Figure 6.
- Figure 7
- Figure 7—figure supplement 1.
- Figure 8
- Figure 8—figure supplement 1.
- Figure 9
- Figure 9—figure supplement 1.
- Figure 9—figure supplement 2.
- Figure 10
- Figure 10—figure supplement 1.
- Figure 11.
- All Figure Page
- Back to All Figure Page
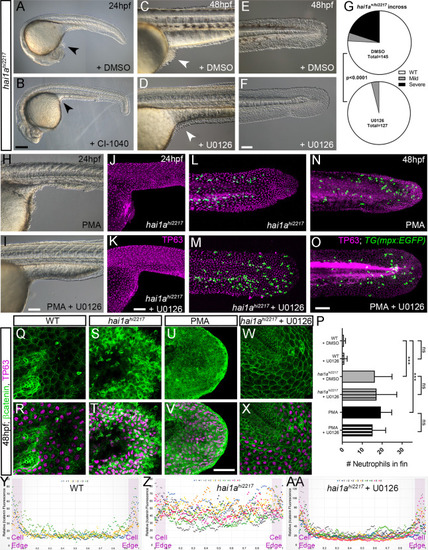
(A–F) Lateral DIC images of 24hpf (A, B) or 48hpf (C–F) hai1ahi2217 embryos treated with either DMSO (A, C, E), 1.3 µM CI-1040 (B), or 100 µM U0126 (D, F) showing rescue of general morphology (B), trunk (D), and tail (F) epidermal phenotypes compared to DMSO-treated hai1ahi2217. Epidermal aggregates under the yolk are reduced in the treated mutants (A–D; arrowheads). (G) Proportion of 48hpf larvae derived from hai1a+/hi2217 incross showing mild or severe hai1a epidermal phenotype following DMSO (upper) or U0126 (lower) treatment (Chi-squared test). (H, I) Lateral DIC images of 24hpf embryo treated with 125 ng/ml phorbol 12-myristate 13-acetate (PMA) (H) or PMA and U0126 (I). Yolk-associated epidermal aggregates are reduced. (J–M) Lateral projected confocal images of hai1ahi2217; Tg(mpx:eGFP)i114 trunk at 24hpf (J, K) and tail at 48hpf (L, M), either treated with 0.5% DMSO (J, L) or U0126 (K, M). Embryos are immunostained for TP63 (magenta) and eGFP (green), highlighting rescue of epidermal phenotype but no reduction of neutrophils. (N, O) Lateral projected confocal images of Tg(mpx:eGFP)i114 treated with PMA alone (N) or PMA with U0126 (O) and immunostained for TP63 (magenta) and eGFP (green). Fin morphology is restored but neutrophils are still present. (P) Quantification of neutrophils in the fins showing U0126 does not reduce inflammation induced by loss of hai1a or PMA treatment. n = 8; ANOVA with Bonferroni post-test; ***p<0.001. (Q–X) Projected confocal images of 48hpf larval tails immunostained for β-catenin (green) and TP63 (magenta; R, T, V, X) of WT (Q, R, U, V) and hai1ahi2217 (S, T, W, X), either untreated (Q–T), treated with PMA (U, V) or U0126 (W, X). (Y–AA) Profile plots of fluorescence distribution across cells of WT (Y), hai1ahi2217 (Z), and hai1ahi2217 treated with U0126 (AA). X-axis represents width of the cell. β-catenin immunofluorescence intensity (Y-axis) shows majority at cell edge (demarcated in light purple) in WT and rescued hai11a mutants, but is distributed in cytoplasm in mutant. Two cells per 3–5 larvae were analysed. Scale bars: (B) = 200 µm, (F, I, K, O) = 100 µm, (V) = 20 µm. |